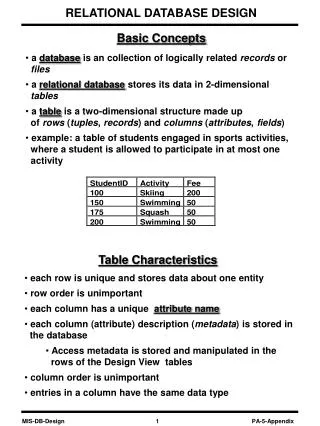
Basic Geographic Concepts
Basic Geographic Concepts. GEOG 370 Instructor: Christine Erlien. Basic Geographic Concepts. Real World Digital Environment How are real world objects recorded in digital format? Directly (by instruments on the ground) Remotely (by satellites hundreds of miles above the earth’s surface)

Basic Geographic Concepts
E N D
Presentation Transcript
Basic Geographic Concepts GEOG 370 Instructor: Christine Erlien
Basic Geographic Concepts Real World Digital Environment How are real world objects recorded in digital format? • Directly (by instruments on the ground) • Remotely (by satellites hundreds of miles above the earth’s surface) • Collected by census takers • Extracted from documents or maps
From Real World Objects to Cartographic Objects • Real world objects differ in: • Size • Shape • Color • Pattern • These differences affect how these objects are represented digitally
Real World Cartographic Objects: Description • Attributes • Information about object (e.g., characteristics) • Location/Spatial information • Coordinates • May contain elevation information • Time • When collected/created • Why? Objects may have different attributes over time
Generalizing Real World Objects • Point: Location only • Line • 1-D: length • Made up of a connected sequence of points • Polygon • 2-D: length & width • Enclosed area • Surface • 3-D: length, width, height • Incorporates elevation data
Scale affects how an object is generalized Close-up (large scale) houses appear to have length & width Small-scale houses appear as points
Generalizing Spatial Objects (Cont.) • Representing an object as point? line? polygon? • Depends on • Scale (small or large area) • Data • Purpose of your research • Example: House • Point (small scale mapping) • Polygon • 3D object (modeling a city block)
Data: Continuous vs. discrete • Continuous • Data values distributed across a surface w/out interruption • Examples: elevation, temperature • Discrete • Occurs at a given point in space; at a given spot, the feature is present or not • Examples • Points: Town, power pole • Lines: Highway, stream • Areas: U.S. Counties, national parks
Continuous & discrete? • Some data types may be presented as either discrete or continuous • Example • Population at a point (discrete) • Population density surface for an area (continuous)
Selection of world’s largest cities http://www.citypopulation.de/World.html
Generalities • Continuous data • Raster • Discrete data • Vector
Spatial Measurement Levels Three levels of spatial measurement: • Nominal scale • Ordinal level • Interval/ratio
Spatial Measurement Levels: Nominal • Simplest/lowest level of measurement • Identification/labeling of data • Does not allow direct comparisons between one named object and another • Notes difference
Spatial Measurement Levels: Ordinal • Data ranked based on a particular characteristic • Gives us insights into logical comparisons of spatial objects • Examples: • Large, small, medium sized cities • Interstate highway, US highway, State highway, Country road
Spatial Measurement Levels: Interval • Numbers assigned to items measured • Measured on a relative scale rather than absolute scale • 0 point in scale is arbitrary • Data can be compared with more precise estimates of the differences than nominal or ordinal levels • Not very common
Spatial Measurement Levels: Interval • Example: Temperature • Zero temperature varies according to the unit of measurement (0 deg. C = 32 deg. F) • 0 deg. C is not the absence of heat Absolute zero is identified by 0 Kelvin
Spatial Measurement Levels: Interval • The difference between values makes sense, but ratios of interval data do not • Ex.: A piece of metal at 300 degrees Fahrenheit is not twice as hot as a piece of metal at 150 degrees Fahrenheit • Why? the ratio of these values is different using Celsius 150 deg. F=66 C 300 deg. F.=149 deg. C
Spatial Measurement Levels: Ratio • Numbers assigned to items measured • Measured on an absolute scale (use true 0 point in scaling) • Measurements of length, volume, density, etc. • Data can be compared with more precise estimates of the differences than nominal or ordinal levels
Spatial Measurement Levels: Ratio • Examples • Locational coordinates in a standard system • Total precipitation • Population density • Volume of stream discharge • Areas of countries
Measurement Levels & Mathematical Comparisons • Nominal scale • Not possible • Ordinal scale • Compare in terms of greater than, less than, equal to • Interval/ratio scales • Mathematical operations • Interval: addition, subtraction • Ratio: add, subtract, multiply, divide
Summarizing We’ve been talking about • Characterizing objects • How to generalize/represent real world objects? • Attributes • Continuous vs. discrete data types • Spatial measurement levels We’re moving on to location
Spatial Location and Reference Communicating the location of objects • Absolute location • Definitive, measurable, fixed point in space • Requires a reference system (e.g., grid system such as Latitude/Longitude) • Relative location • Location determined relative to other objects in geographic space • Giving directions • UTM
Spatial Location and Reference: Latitude / Longitude • Most commonly-used coordinate system • Lines of latitude are called parallels • Lines of longitude are called meridians
Latitude / Longitude • Prime Meridian & Equator are the reference points used to define latitude and longitude
Spatial Comparisons • Pattern analysis: An important way to understand spatial relationships between objects. • Three point distribution patterns: • Regular: Uniform • Clustered • Random: No apparent organization
Describing Spatial Patterns • Proximity: Nearness • Orientation: Azimuthal direction (N,S,E,W) relating the spatial arrangement of objects • Diffusion: Objects move from one area to another through time • Density
Relationships between sets of features • Association: Spatial relationship between different characteristics of the same location • Example: Vegetation-elevation • Correlation: Statistically significant relationship between objects that are associated spatially
Collecting Geographic Data • Small areas • Ground survey • Census • Large areas • Census (less oftenevery 10 years) • Remote sensing • GPS (e.g., collared animals)
Collecting Geographic Data: Sampling & Sampling Schemes • Sampling: When a census isn’t practical • Types of sampling • Directed: Based on experience, accessibility, selection of particular study areas • Probability-based: For the total population of interest, each element has a known probability of being selected
Sampling & Sampling Schemes • Probabilistic sampling methods • Random: Each feature has same probability of selection • Systematic: Repeated pattern guides sample selection • Homogeneous • Stratified: Area divided based on particular characteristics, then features sampled w/in selected areas
Samples: Making inferences • Why? Sampling leaves gaps in knowledge • What to do? Use models to predict missing values • Interpolation: Predicting unknown values using known values occurring at locations around the unknown value • Extrapolation: Predicting missing values using existing values that exist only on one side of the point in question
Important Concepts from Ch.2 • How real world objects may be generalized in the digital environment • How the representation of real world objects may change based on the scale of observation • Discrete vs. continuous data • Measurement levels: nominal, ordinal, interval, ratio
Important Concepts from Ch.2 • Lat/long • Absolute vs. relative location • Describing spatial patterns • Collecting geographic data and how it might differ based on size of study area • Sampling & sampling methods