Download

1 / 19
190 likes | 331 Views
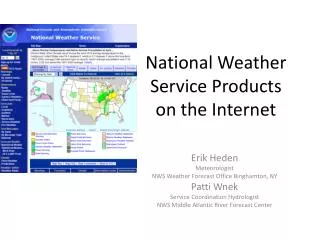
National Weather Service Goes Digital With Internet Mapping. Ken Waters National Weather Service, Honolulu HI Jack Settelmaier National Weather Service, Fort Worth TX ESRI International User Conference -- August 12, 2004. Weather Data and GIS. Lots of observed data

E N D
National Weather Service Goes Digital With Internet Mapping Ken Waters National Weather Service, Honolulu HI Jack Settelmaier National Weather Service, Fort Worth TX ESRI International User Conference -- August 12, 2004
Weather Data and GIS • Lots of observed data • 6-minute radar data around the country • 15-minute satellite imagery • Thousands of hourly reporting stations (e.g., Airports, automated stations) • 12-hourly upper air reports around the country sensing the vertical atmosphere • Other data sources (airlines, “mesonets”)
Weather Data and GIS • Forecast Data • Various hourly and daily forecast products of temperature, weather (e.g., rain, snow), chance of precipitation • New National Digital Forecast Database (NDFD) producing up to hourly surface sensible weather elements on a fine national grid (2.5 – 5 km) of temperature, precipitation, wind, etc.
Weather Data and GIS • Lots of data! • Although all of this data have a geospatial aspect…i.E., A latitude, longitude, and height….. • Not disseminated in a geospatial form by the agency • Rather, most disseminated in text or other formats common to the industry (e.g. GRIB, netCDF, BUFR, etc.) but not to the GIS community
Weather Data and GIS • Why are weather data different? • 1) vertical factor • Many of our processing systems must be able to store, access, and view meteorological data in 3-dimensions --- not particularly supported by existing GIS • 2) time factor • Meteorologists are very concerned with changes in time…scale of seconds…minutes…hours…days…and more in the case of climate • Also, weather changes some times very quickly, such as a fast-moving tornado --- so currency of data is very important
Current State of GIS Use in National Weather Service • All NWS offices have copy of ArcView 3.1, primarily for editing background shapefiles such as zone boundaries • River Forecast Centers using ESRI tools to produce hydrologic datasets and analyses • A few IMS prototypes running (e.g., EMHURR) • Still…..we’re substantially behind the GIS curve
Short-fuse Warnings • NWS produces tornado, severe thunderstorm, and special marine warnings • A major product of the NWS, used to protect life and property • Warnings typically with 10-15 minutes warning time, so fast response is critical • Primary dissemination is through the EAS and NOAA Weather Radio systems
Short-fuse Warnings • Historically, these have been county-based • Coordinated with county emergency managers and set to trigger NOAA Weather Radios based on county being warned
Short-fuse Warnings • CHALLENGE: Counties frequently either very large or of irregular shape
Short-fuse Warnings • So, weather could be actually impacting only small portion of the county
Short-fuse Warnings • Since 1998, most NWS offices have been inserting polygon lat-lon pairs to define area of severe weather in these warnings
Short-fuse Warnings • Hundreds of warnings issued in a 24-hour period
Short-fuse Warnings • Value of the polygon concept not fully utilized though due to dissemination constraints (e.g. NOAA Weather Radio) • NWS has sanctioned a team to change fully adopt the polygon approach for issuing warnings
Short-fuse Warnings • Using GIS methods, NWS will be able to apply more advanced dissemination methods (e.g., converting polygons into targeted smaller areas) • Spatial analysis will allow verification of warnings --- did the tornado occur inside of the polygon? • First efforts include real-time conversion of warnings into shapefiles: (http://www.prh.noaa.gov/regsci/GIS)
National Digital Forecast Database • New NWS product of gridded points across the country at 5 km spacing of values of temperature, wind, weather, etc.
National Digital Forecast Database • Currently data are available in “GRIB2” format, mostly only used by meteorology community • Efforts at hand to convert to more common formats, including UNIDATA’s netCDF format and into GIS shapefile and grid formats
NWS Internet Mapping Systems • NWS has begun to explore ways to take advantage of new technologies such as XML and Internet Mapping Systems to better disseminate warnings, forecasts, and observations to the public • One example is the EMHURR site, which included NDFD forecast wind grids
NWS Internet Mapping Systems • Future plans to use Internet Mapping Systems to improve response times and service to our emergency manager partners • Plans to install IMS servers at each of our regional webfarms to disseminate our data
Questions? Ken Waters Regional Scientist NWS Pacific Region Headquarters Honolulu, HI 96813 Ken.waters@noaa.gov Jack Settelmaier Technique Development Meteorologist NWS Southern Region Headquarters Fort Worth, TX 76102 Jack.settelmaier@noaa.gov