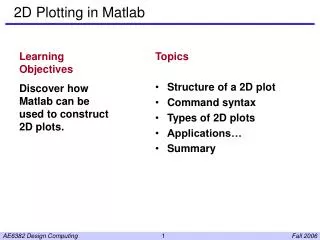
Plotting in MATLAB
Plotting in MATLAB. http://blog.naver.com/gajest. Contents. 1. Introduction. 2. 2 차원 그래프 작성. 3. 그래프 작성의 관련 함수의 이용. 4. Exercises. Introduction. MATLAB 를 사용하여 그래프를 작성 POLAR, SEMI-LOG, LOG-LOG 와 같은 다른 형태의 그래프 작성 그래프 작성에 관련된 그밖에 함수 또는 기능을 알아본다. Basic Two-Dimensional Plots.

Plotting in MATLAB
E N D
Presentation Transcript
Plotting in MATLAB http://blog.naver.com/gajest
Contents 1. Introduction 2. 2차원 그래프 작성 3. 그래프 작성의 관련 함수의 이용 4. Exercises DSRL
Introduction • MATLAB를 사용하여 그래프를 작성 • POLAR, SEMI-LOG, LOG-LOG와 같은 다른 형태의 그래프 작성 • 그래프 작성에 관련된 그밖에 함수 또는 기능을 알아본다. DSRL
Basic Two-Dimensional Plots plot(x,y) : x, y 값은 1 차원 데이터 배열 (원소 수 동일) >> x=linspace(0,4*pi,200); >> y=sin(x); >> plot(x,y); >> title('A simple plot using MATLAB') >> ylabel('Sin(x)'); >> xlabel('x (Radians)'); >> plot(x, cos(x)) DSRL
Basic Two-Dimensional Plots hold on : 현재의 plot에 새 plot 추가 >> x=linspace(0,4*pi,200); >> y=sin(x); >> plot(x,y); >> title ('A simple plot using MATLAB') >> ylabel('Sin(x)'); >> xlabel('x (Radians)'); >> hold on >> plot(x,cos(x)) >> z=abs(sin(x)); >> plot(x,z); >> zz=sin(x).*sin(x); >> plot(x,zz); DSRL
Basic Two-Dimensional Plots hold off : 기존의 plot를 지우고 새 plot를 작성 >>hold off >>x=linspace(0,4*pi,200); >>y=sin(x); >>plot(x,y,x,cos(x)); >>xlabel('x - (Radians)'); >>title('Sine and Cosine Functions'); DSRL
Basic Two-Dimensional Plots >> x=linspace(0,4*pi,200); >> y=sin(x); >> z=abs(sin(x)); >> zz=sin(x).*sin(x); >> plot(x,y,x,cos(x),x,z,x,zz); >> xlabel('x - (Radians)'); >> title('Various Functions'); >>legend('sin(x)', 'cos(x)','abs(sin(x))','sin(x)*sin(x)‘) 선의 색이 다름 DSRL
Basic Two-Dimensional Plots By making x a column array, but same x-coordinate >> x=linspace(0,4*pi,200)’; >> y=[sin(x), cos(x), abs(sin(x)), sin(x).*sin(x)]; >> plot(x,y); >> legend('sin(x)','cos(x)','abs(sin(x))','sin(x)*sin(x)') >> xlabel('x - (Radians)'); >> title('Various Trigonometric Functions'); DSRL
Basic Two-Dimensional Plots Same number of points, but different x- and y- coordinates >> x1=linspace(0,pi,10)'; >> x2=linspace(pi,2*pi,10)'; >> x3=linspace(2*pi,3*pi,10)'; >> x4=linspace(3*pi,4*pi,10)'; >> x=[x1,x2,x3,x4]; >> y1=sin(x1); >> y2=cos(x2); >> y3=abs(sin(x3)); >> y4=sin(x4).*sin(x4); >> y=[y1,y2,y3,y4]; >> plot(x,y) >> legend('sin(x)', 'cos(x)','abs(sin(x))','sin(x)*sin(x)',4) >> xlabel('x - Radians'); >> title('Various Trigonometric Function'); DSRL
Basic Two-Dimensional Plots Different number of points >> x1=linspace(0,2*pi,10); >> x2=linspace(0,2*pi,50); >> x3=linspace(pi,2*pi,100); >> x4=linspace(pi/3,2*pi,150); >> y1=sin(x1); >> y2=cos(x2); >> y3=abs(sin(x3)); >> y4=sin(x4).*sin(x4); >> plot(x1,y1,x2,y2,x3,y3,x4,y4); >> legend('sin(x)', 'cos(x)','abs(sin(x))','sin(x)*sin(x)',4) >> xlabel('x - Radians'); >> title('Various Trigonometric Function'); DSRL
Line Styles, Markers, and Colors plot (x1 , y1 , s1 , x2 , y2 , s2 , x3 , y3 , s3 …..) DSRL
Line Styles, Markers, and Colors >> x1=linspace(0,2*pi,10); >> y1=sin(x1); >> plot(x1,y1,'gs',x2,y2,'kp:',x3,y3,x4,y4,'r--'); >> title('Various Trigonometric Function'); 3 변수를 모두 지정할 필요는 없음 DSRL
Plot Colors WHITEBG : Plot의 배경색을 바꾸는 함수 >> x1=linspace(0,2*pi,10); >> y1=sin(x1); >> plot(x1,y1,'gs',x2,y2,'kp:',x3,y3,x4,y4,'r--'); >> xlabel('x-Radians'); >> title('Varous Trigonometric Fuctions'); >> whitebg('y'); >> whitebg(‘m’) DSRL
Plotting Grid Grid on – 격자 표시 Grid off –격자 제거 Grid – 토글 >> x1=linspace(0,2*pi,10); >> y1=sin(x1); … >> plot(x1,y1,'gs',x2,y2,'kp:',x3,y3,x4,y4,'r--'); >> legend('sin(x)','cos(x)','abs(sin(x))','sin(x)*sin(x)',3) >> xlabel('x-Radians'); >> title('Varous Trigonometric Fuctions'); >> grid on DSRL
The Axis Command axis( [Xmin Xmax Ymin Ymax] ) axis auto : MATLAB이 축의 limits 값을 정함 …………… >> plot(x1,y1,'gs',x2,y2,'kp:',x3,y3,x4,y4,'r--'); >> grid on >> axis( [ 3 5 0 1 ] ) DSRL
Placing Text on a Plot … >> plot(x1,y1,'gs',x2,y2,'kp:',x3,y3,x4,y4,'r--'); … >> text(0.5 , -0. 25 , ‘LEGEND’) text(x , y , ’ str ’) DSRL
Placing Text on a Plot gtext : 마우스를 이용하여 지정한 위치에 문자 출력 >> gtext(‘This is a text’); DSRL
Modifying Text with TEX Commands x=linspace(-4,4,200); y=exp(-x.*x); plot(x,y); text(-3,0.7,'\alpha\beta\gamma\omega\zeta\epsilon') text(-3,0.6,'\Gamma\Omega\Sigma\Lambda\Theta') text(-3,0.5,'\Uparrow\downarrow\ldots\rightarrow\approx\equiv\subset') DSRL
Modifying Text with TEX Commands set : 그래프영역을 줄여 윗 첨자를 쓸 수 있게 한다. >> set(gca,'PlotboxAspectRatio',[1,0.7,1]) >> title('Plot of y=x^{3x}+x^2+x^{-100}') >> xlabel('X_{axis} - x_1+x_2+x_{333}') >> ylabel('Y_{axis} - A Plot of an Equation') DSRL
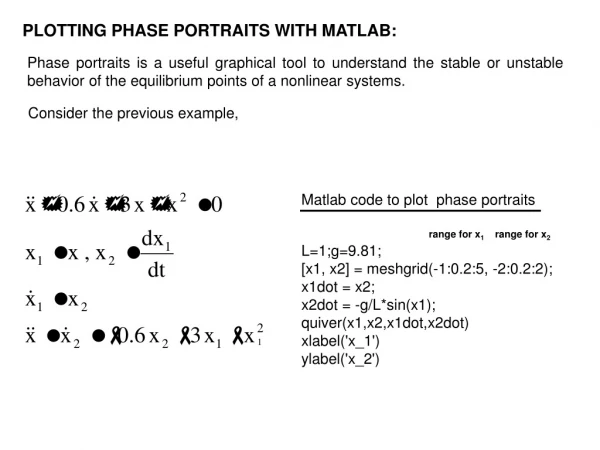
Obtaining Numerical Values form Plot GINPUT: 그래프에서 수치 값을 얻는 함수 figure(1) msg1=sprintf('Place the cursor at the location of a point you wish to'); msg1=[msg1,sprintf('see the numerical values and then press')]; msg1=[msg1,sprintf('the LEFT mouse button.')]; h=msgbox(msg1); waitfor(h) [x1,y1]=ginput(1); msg2=sprintf('Place the cursor at the location of where you would');. msg2=[msg2,sprintf('like to display the values on the plot and then')]; msg2=[msg2,sprintf('press the LEFT mouse button.')]; h=msgbox(msg2); waitfor(h) [x2,y2]=ginput(1); str=sprintf('x=%5.3f,y=%5.3f',x1,y1); line([x1,x2],[y1,y2]); text(x2,y2,str); . h=msgbox(msg1); % 작은 메시지 박스를 열고, msg1 값을 표시하고, 핸들 값 h를 반환 waitfor(h)% 기다리면서, OK 버튼을 누르면 메시지 박스가 지워지며 실행을 계속 [x1,y1]=ginput(1); % 현재 그림에 격자를 그리며, 마우스 버튼 클릭을 기다림 DSRL
Various MATLAB 2-D Plot Types • SEMILOGX SEMILOGX : x축은 로그 스케일로 사용하고, y축은 선형 축을 사용하여 그래프 출력 >> omega=logspace(1,4,200); >> mag=20*log10(abs(1000./(i*omega+1000))); >> semilogx(omega,mag); >> axis([10,10000,-20 5]); >> grid on; >> Ylabel(‘Gain(dB)’); >> Xlabel(‘Frequency(rad/sec)’); >> Title(‘Bode Magnitude plot of Vo/Vin’); DSRL
Various MATLAB 2-D Plot Types SEMILOGY : x축은 선형 축을 사용하고, y축은 로그스케일을 사용하여 그래프 출력 >> x=linspace(0,100,200); >> y=5 .*10 .^(3 .*x); >> k=log10(y); >> plot(x,k) >> ylabel(‘Log10(y)’); >> xlabel(‘x’) DSRL
Various MATLAB 2-D Plot Types x=linspace(0,100,200); y=5.*10.^(3.*x); semilogy(x,y) ylabel('y'); xlabel('x'); DSRL
Various MATLAB 2-D Plot Types • LOGLOG LOGLOG : 로그 축을 사용하여 그래프 출력 >> x=linspace(0,1,200); >> y=5 .*10 .^(3 .*x); >> semilogy(x,y) >> ylabel('y'); >> xlabel('x'); >> x=linspace(0,1,200); >> y=5 .*10 .^(3 .*x); >> plot(x,y) >> ylabel('y'); >> xlabel('x'); DSRL
Various MATLAB 2-D Plot Types • LOGLOG >> x=linspace(0.001,100,1000); >> y=5.*10.^(3.*x); >> plot(x,y) >> ylabel('y'); >> xlabel('x'); >> x=logspace(-3,2,1000); >> y=5 .*10 .^(3 .*x); >> loglog(x,y) >> ylabel('y'); >> xlabel('x'); DSRL
Various MATLAB 2-D Plot Types • POLAR polar : 극좌표 축을 사용하여 그래프 출력 >> theta=linspace(0,8*pi,200); >> r=2*theta; >> polar(theta,r) theta=linspace(1,20*pi,1000); r=5*log10(theta); polar(theta,r) DSRL
Various MATLAB 2-D Plot Types • COMET COMET : 그래프 그리는 과정을 애니메이션으로 보여 준다. theta=linspace(1,20*pi,1000); r=5*log10(theta); x=r.*cos(theta); y=r.*sin(theta); comet(x,y); title('Logarithmic Spiral'); DSRL
Various MATLAB 2-D Plot Types • SUBPLOT SUBPLOT: 하나의 그림 창에 여러 개의 그래프 출력을 얻고자 할 때 subplot(2,3,1) theta=linspace(1,20*pi,1000); r=5*log10(theta); polar(theta,r) title('Logarithmic Spiral'); subplot(2,3,2) theta=linspace(0,8*pi,200); r=2*theta; polar(theta,r) title('LInear Spiral') DSRL
Various MATLAB 2-D Plot Types • Working with Multiple Figures figure: 새로운 그림 창을 만든다. clf : 그림 창에 나타나 있는 그래프 제거 EDU>> f1=figure f1 = 1 EDU>> f2=figure f2 = 2 EDU>> f3=figure(25) f3 = 25 DSRL
Various MATLAB 2-D Plot Types • Working with Multiple Figures >> subplot(2,1,1) >> omega=logspace(0,5,200); >> mag=20*log10(abs(1000 ./(i*omega+1000))); >> semilogx(omega,mag); >> axis([10, 10000 , -20 , 5]); >> grid on; >> ylabel('Gain(dB)'); >> xlabel('Frequency (rad/sec)'); >> title('Bode Magnitude plot of Vo/Vin'); >> subplot(2,1,2); >> rad_to_deg=360/(2*pi); >> phase = rad_to_deg*angle(1000./(i*omega+1000)); >> semilogx(omega,phase); >> grid on; >> ylabel('Angle (Degrees)'); >> xlabel('Frequency (rad/sec)'); >> title('Bode Phase plot of Vo/Vin'); DSRL
Various MATLAB 2-D Plot Types • Working with Multiple Figures >> figure(f1) >> theta=linspace(1,20*pi,1000); >> r=5*log10(theta); >> polar(theta,r) >> figure(f2) >> x=linspace(0,100,200); >> y=5 .*10 .^(3 .*x); >> semilogy(x,y) >> ylabel('y') >> xlabel('x') DSRL
Handle Graphics for Manipulating Plot • Obtaining a Handle for an Object Handles from Plot Commands omega=logspace(1,4,200); mag=20*log10(abs(1000./(i*omega+1000))); hp=semilogx(omega,mag) hp = 74.0074 axis([10,10000,-20 5]); grid on; DSRL
Handle Graphics for Manipulating Plot • Obtaining a Handle for an Object Text object >> hy=ylabel('Y-Axis-') hy = 20.007 >> hx=xlabel('Time(Seconds)') hx = 21.007 >> ht=title('Various Trigonometric Functions') ht = 22.007 >> htext=text(4,0.8,'This is a test.') htext = 23.007 Axes Handle (GCA) : active 상태의 figure안에 있는 axes의 해당 handles를 반환 >> h_axes = gca ; DSRL
Handle Graphics for Manipulating Plot • Modifying an Object with the SET Command SET : 객체(Object)의 속성을 변화시킬 수 있는 함수 text의 글꼴, 크기, 폭, 색상, 각도 등을 바꾼다 >> set(ht) Color EraseMode: [ { normal} | background | xor |none ] Editing : [ on | off ] FontAngle : [ { normal } | italic | oblique ] FontName FontSize …. ButtonDownFcn Children Clipping: [ {on} | off ] … Tag UserData Visible : [ {on} | off ] DSRL
Handle Graphics for Manipulating Plot • Modifying an Object with the SET Command Modifying Text object >> set( ht , ‘FontName’, ‘Courier New’); >> set( ht, ‘FontSize’, 24 ) >> set( ht,’Rotation’, 90, ‘FontWeight’, ‘bold’) DSRL
Handle Graphics for Manipulating Plot • Modifying an Object with the SET Command Modifying Text object set(ht,'Rotation',0,'Fontsize',18,'color','c') set(hy,'Fontname','Arial','Fontsize',18,'color','r') set(hx,'Fontname','Arial','Fontsize',18,'color','g') set(htext,'Fontname','Arial','Fontsize',18,'color','m') set(h_axes,'Fontname','Arial','Fontsize',14,'color','y') set(h_axes,'Ycolor','r','Xcolor','g') DSRL
Handle Graphics for Manipulating Plot • Changing the Default Properties of Figures set(0,'defaultlinelinewidth',2); set(0,'defaultaxesfontname','Arial'); set(0,'defaultaxesfontsize',14); set(0,'defaultaxeslinewidth',2); set(0,'defaulttaxtfontsize',14); set(0,'defaulttaxtfontname','Arial'); DSRL
Handle Graphics for Manipulating Plot • Modifying Fonts with UISETFONT >> uisetfont(hy,'specify the font y-axis.') DSRL
Handle Graphics for Manipulating Plot • Modifying Fonts with UISETCOLOR >> uisetcolor(hy,’Specify the font color for y-axis.’) DSRL
http://blog.naver.com/gajest Thank You !