4 th International Workshop on Digital Soil Mapping
10 likes | 148 Views
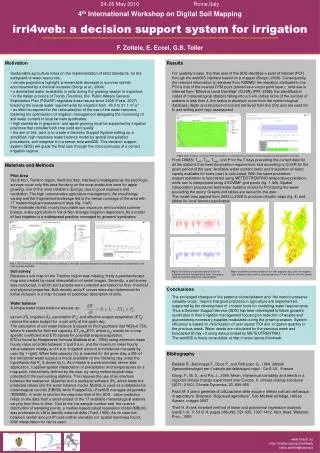
24-26 May 2010 Rome,Italy. 4 th International Workshop on Digital Soil Mapping. irri4web: a decision support system for irrigation. F. Zottele, E. Eccel, G.B. Toller. Motivation. Results.

4 th International Workshop on Digital Soil Mapping
E N D
Presentation Transcript
24-26 May 2010 Rome,Italy 4th International Workshop on Digital Soil Mapping irri4web: a decision support system for irrigation F. Zottele, E. Eccel, G.B. Toller Motivation Results • Sustainable agriculture relies on the implementation of strict standards for the safeguard of water resources. • climate projections highlight a remarkable decrease in summer rainfall, accompanied by a thermal increase (Giorgi et al., 2004); • a diminished water availability in soils during the growing season is expected; • in the Italian province of Trento (Trentino), the Public Waters General Exploitation Plan (PGUAP) regulates these issues since 2006 (Fezzi, 2007) lowering the overall water requirements for irrigation from 40.3 to 21.1 m3 s-1 • an effort is required for the rationalization of the use of the water resource, fostering the optimisation of irrigation management delegating the monitoring of soil water content to local farmers syndicates; • high standards in grapevine- and apple-growing must be supported by irrigation practices that consider both crop yield and quality • the aim of this work is to create a Decision Support System setting up a simplified, high resolution water balance model by spatial interpolation procedures, and integrate it in a server-side webGIS. This decision-support system (SDS) will guide the final user through the choice process of a correct irrigation regime. For usability’s sake, the final user of the SDS identifies a point of interest (POI) through the webGIS interface based on p.mapper (Burger, 2008). Consequently, the relevant information is retrieved from RDBMS: the elevation attributed to the POI is that of the nearest DTM point (stored as a vector point layer); land use is inferred from “Effective Land Use Map” (CUSR) (PAT, 2006); the identification codes of meteorological stations falling into a 5-km-radius circle (if the number of stations is less than 4, the radius is doubled) come from the meteorological database; depth and structure of soil are retrieved from the CPp and are used for fc and wilting point (wp) assessment. From DBMS: Tmin, Tdm, Tmax, and P for the 7 days preceding the current date for all the stations that meet the position requirement, kcd according to CUSR for the given period of the year. Available water content (awc) and the portion of water rapidly available for roots (raw) is calculated. With the same procedure evapotraspiration is forecasted using METEOTRENTINO temperature prevision, while rain is interpolated using 4 ECWMF grid points (fig. 1-left). Spatial interpolation procedures feed water-balance model for POI during the week preceding the query. Graphs and tables are served to the user. The model was applied from 2002 to 2008 to produce climatic maps (fig. 4) and tables for local farmers syndicates. Fig 2. SDS interface: on the left POI identification, on the right the soil water content forecast is presentented to final user Materials and Methods Pilot Area Val di Non, Trentino region, Northern Italy, has been investigated as the pedologic surveys cover only this area focusing on the most productive zone for apple growing, one of the most notable in Europe, due to good exposure and ventilation. The high remunerative agriculture management, the morphology variety and the fragmented landscape led to the dense coverage of the area with 17 meteorological measurement sites (fig. 1-left). The moderate rainfall, mostly favourable sun exposure, and constant summer breeze, make agriculture in Val di Non strongly irrigation-dependent. As a matter of fact irrigation is a widespread practice, managed by growers’ syndicates. Soil survey Because a soil map for the Trentino region was missing, firstly a pedolandscape map was created by visual interpretation of aerial images. Secondly, a soil survey was conducted, in which soil samples were collected and tested for their chemical and physical properties. Bulk density and pF curves were also determined for futher inclusion in a map focused on pedologic description of soils. Water balance A simple water mass balance was set up: as rain (R), irrigation (Ir), percolation (Pp) and effective evapotranspiration (ETa) returns the water budget for a soil unity at the given day. The calculation of soil water balance is based on the hypothesis that W[0]=0.75fc, where fc stands for field soil capacity. ETa=kcdET0, where kcd stands for a crop-specific coefficient and ET0 stands for potential evapotranspiration. ET0 is found by Hargreaves’ formula (Battista et al., 1994) using minimum mean hourly value recorded between 3 and 9 a.m. and the maximum mean hourly value between midday and 4 p.m. Irrigation amount is introduced manually by user (fig 1-right). When field capacity (fc) is reached for the given day, a fifth of the remainder water surplus is made available on the following day under the hypothesis that Pp is driven by fc. As irri4web is a web-oriented, server side application, it applies spatial interpolation of precipitation and temperatures on a map point, interactively defined by the user, by using meteorological data collected at the surrounding stations. This requires the use of an interface between the webserver (Apache) and a statistical software (R), which feeds the predicted values into the water balance model. MySQL is used as a datastore for meterological records (DBMS) while PostgreSQL+PostGIS manages all geodata (RDBMS). In order to shorten the response time of the SDS, value prediction relies on the data from a small subset of the 17 available meteorological stations varying from time to time. Due to the low sample number and the uneven distribution of sampling points, a median based robust regression model (MBLM) was preferable to LM to identify external drifts (Theil, 1950). As no clear link between rainfall amount (P) and neither elevation nor spatial trend was found, IDW interpolation for rain is used. Fig 1. SDS interface: on the left study area is presented, on the right spatial interpolation of rain and temperature is presented to final user as graph and table Fig 3. Simulations of soil water deficit in the non irrigated (red) and irrigated (blue) case. The graphs represent spatial average for Cles syndicate Fig 4. Soil water content forecast for the 196° gregorian day. Left: non irrigated, rigth: irrigated. Color scale is homogenized from 14 mm (red) to 190 mm (green) Conclusions The envisaged changes in the patterns of precipitation and the need to preserve valuable crops, require that good practices in agriculture are implemented, supported by the development of modern tools for modelling water requirements. Thus a Decision Support Service (SDS) has been developed to follow growers’ syndicates in their irrigation management focusing on reduction of wastes and guaranteeing necessary supplies modulated during the growing season. System efficiency is based on minimization of user inputs: POI and irrigation quantity in the previous week. Water needs are calculated for the previous week and forecasted till day +3 using data provided by METEOTRENTINO. The webGIS is freely consultable at http://meteo.iasma.it/irri4web Bibliography Battista R., Benincasa F., Duce P., and Pellizzaro G., 1994. Metodi Agrometeorologici per il calcolo dei fabbisogni irrigui - Ce.S.I.A., Firenze Giorgi, F., Bi, X., and Pal, J., 2004. Mean, interannual variability and trends in a regional climate change experiment over Europe. II: climate change scenarios (2071- 2100). Climate Dynamics, 23, 839-858. Fezzi M. Il piano generale di utilizzazione delle acque e riflessi sull’uso dell’acqua in agricoltura. Simposio “Acqua ed agricoltura”, San Michele all’Adige, Istituto Agrario, maggio 2007 Theil H. A rank invariant method of linear and polynomial regression analysis (parts 1-3). V. 53 of A, pages 386-392, 521-525, 1397-1412. Ned. Akad. Wetensh. Proc., 1950 www.fmach.eu http://meteo.iasma.it/irri4web fabio.zottele@iasma.it