Download
1 / 17
170 likes | 193 Views
Chapter 4 Individual Market Demand. A. Price and Quantity. Price – the amount of money paid for an economic good/service Ex. A gallon of gasoline has a price of $3.00 Quantity – the amount of items Ex. If I buy a dozen eggs, then the quantity is 12 eggs. B. Demand.

E N D
Chapter 4 Individual Market Demand
A. Price and Quantity • Price – the amount of money paid for an economic good/service • Ex. A gallon of gasoline has a price of $3.00 • Quantity – the amount of items • Ex. If I buy a dozen eggs, then the quantity is 12 eggs
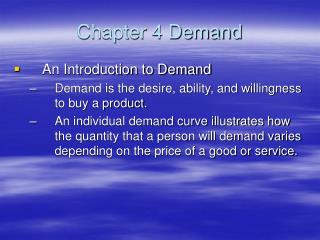
B. Demand • Consumers’ willingness and ability to buy an item at a given price • Willingness means that buyers must want the item • Ability means that buyers must have the financial resources to afford the item • It is important to understand that demand does not refer to a numerical amount but instead to a behavior.
C. The Law of Demand • The price of an item determines the quantity demanded • The lower the price the higher the quantity demanded • When goods/services are cheap, I tend to buy more • The higher the price the lower the quantity demanded • When goods/services are expensive, I tend to buy less • Therefore, the price of a good/service is inversely related with the quantity demanded
D. 3 Reasons Why the Law ofDemand Exists • Income Effect • When things are expensive, money buys less • When things are cheap, money buys more • Substitution Effect • When apples are expensive and their substitutes (pears) are relatively cheap, I buy fewer apples and more pears • Diminishing Marginal Utility • Each additional unit of an item purchased gives less marginal utility (happy points) than the previous unit. Therefore, the only way I will buy more is if the price is lower. • Ex. When I’m hungry, I typically will buy 2 breakfast tacos. The reason I don’t buy a third taco is because the marginal utility of the third taco is less than the price of the taco. But, if the price of the taco is less than the marginal utility of the taco, then I will buy the third taco
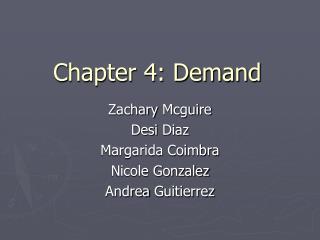
Demand Schedule Mr. Peterson’s Demand for Breakfast Tacos Notice that Mr. Peterson is obeying the law of demand. Now that’s making a good choice!!!!
Tacos Demand Curve P $2.00 $1.50 $1.00 $0.50 D Q 0 1 2 3
E. Changes in Demand • Increase in Demand • More quantity demanded at all prices • Demand Curve shifts • Decrease in Demand • Less quantity demanded at all prices • Demand Curve shifts • Know that Price does not change Demand! Price changes quantity demanded.
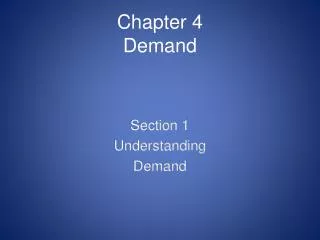
Increase in Demand P D1 D Q
Decrease in Demand P D D1 Q
Change in QuantityDemandedThe graph above shows a change in quantity demanded. This occursOnly when the price of that product changes right now. On a graph thereis movement along a stable demand curve. It doesn’t shift.
The 2 graphs above show a Change in Demand. It is based on a non-price factor: TRIPE. (leave space between 1 – 5 below). 1. Tastes & Preferences 2. Related Goods: Substitutes or Complements. 3. Incomes of Consumers 4. Population Changes 5. Expectations of Future Price Changes. With these changes, there is a shift of the whole curve on the graph. Shifts right
F. Changes in Demand - T.R.I.P.E. 1. Tastes and Preferences • Preferences and tastes are affected by advertising, trends, health considerations, etc. • Ex. Demand for dark chocolate has increased because research has recently shown that it has health benefits • Ex. Demand for spinach decreased when the FDA discovered high concentrations of e. coli.
Changes in DemandT.R.I.P.E. 2. Related Goods • Complements – goods/services used together • Ex. When the price of gasoline increases the demand for its complement, large SUV’s, decreases. • Ex. When the price of movie tickets decreases, the demand for theatre popcorn increases. • Substitutes – goods/services used in in place of other goods/services • Ex. When the price of gasoline increases, the demand for ethanol increases. • Ex. When the price of movie tickets increases, the demand for Red Box DVD’s increases.
Changes in DemandT.R.I.P.E. 3. Income of consumers • When consumers’ income increases: • Demand for normal goods/services increases • Ex. More income means more demand for steak • Demand for inferior goods/services decreases • Ex. More income means less demand for Top Ramen • When consumers’ income decreases • Demand for normal goods/services decreases • Ex. Less income means less demand for steak • Demand for inferior goods/services increases • Ex. Less income means more demand for Top Ramen
Changes in DemandT.R.I.P.E. 4. Population • More population = more demand • Ex. As America’s population grows so does the demand for housing • Less population = less demand • Ex. As Japan’s population declines so does the demand for education (fewer Japanese schools)
Changes in DemandT.R.I.P.E. 5. Expectations of future price changes • If consumers expect prices to rise in the future, then demand increases now • Ex. Prior to Hurricanes Katrina and Rita, consumers expected higher fuel prices and this caused demand for fuel to increase. • If consumers expect prices to fall in the future, then demand decreases now • Ex. If investors believe stock prices are going to decline, then demand for stocks decreases.