Download
1 / 9
140 likes | 757 Views
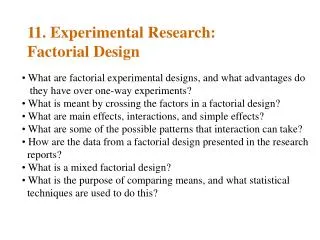
11. Experimental Research: Factorial Design. What are factorial experimental designs, and what advantages do they have over one-way experiments? What is meant by crossing the factors in a factorial design? What are main effects, interactions, and simple effects?

E N D
11. Experimental Research:Factorial Design • What are factorial experimental designs, and what advantages do • they have over one-way experiments? • What is meant by crossing the factors in a factorial design? • What are main effects, interactions, and simple effects? • What are some of the possible patterns that interaction can take? • How are the data from a factorial design presented in the research • reports? • What is a mixed factorial design? • What is the purpose of comparing means, and what statistical • techniques are used to do this?
Factorial Experimental Designs Factorial Experimental Designs Experimental designs with more than one independent variable. The term factor refer to each of manipulated independent variables. 2 Factors Example. IV. Sex (male, female), Ethnicity (Black, White, Asian, Latino) DV. Self-esteem 4 levels 2 levels Black White Asian Ratino M F 20 24 19 20 24 18 20 21 Cells 2 4 designs
The Two-Way Design Example. Violent cartoons and children’s frustrated state increase their aggressive behavior. IV: Violent Cartoons vs. Nonviolent Cartoons Frustrated State vs. Non Frustrated State DV: Children’s aggressive behaviors. Violent Nonviolent Frustrated Not frustrated Av. M = 2.97 Av. M = 3.90 M = 2.68 N= 10 M = 3.25 N= 10 M = 5.62 N= 10 M = 2.17 N= 10 Av. M = 4.15 Av. M = 2.71
Main Effects, Interactions, and Simple Effects The effect of each factors Main Effects The effects in which the influence of one factor on the DV is different at different levels of another factors. Interactions Simple Effects The effect of one factor within a level of another factor Violent Nonviolent Frustrated Not frustrated Av. M = 2.97 Av. M = 3.90 M = 2.68 N= 10 M = 3.25 N= 10 M = 5.62 N= 10 M = 2.17 N= 10 Av. M = 4.15 Av. M = 2.71
ANOVA Summary Table Source Sum of df Mean F p-value Squares Square DV: Aggressive Play Cartoon 23.56 1 23.56 4.56 .04* Prior State 11.33 1 11.33 2.00 .17 Cartoon by Prior State 29.45 1 29.45 5.87 .03* Residual 41.33 36 5.17 Total 94.67 39 59.51
Chart Cartoon Residual Prior State C & PS
Understanding Interactions DV DV DV Frustrated Nonfrustrated Violent Nonviolent Violent Nonviolent Violent Nonviolent Patterns with Main Effects Only
Understanding Interactions DV DV DV Frustrated Nonfrustrated Crossover Interaction Violent Nonviolent Violent Nonviolent Violent Nonviolent Patterns with Main Effects & Interaction Only
Interpretation and Presentation ofMain Effects and Interpretations 2 (cartoon) 2 (prior state) ANOVA was conducted. The results indicated that there were significant main effect of cartoon, F (1, 38) = 4.45, p < .05. Children who viewed the violent cartoon (M = 2.89) were rated as playing more aggressively than children who had viewed the nonviolent cartoon (M = 1.52). This main effect, however, should be qualified by the interaction with prior state, F (1, 36) = 4.42, p < .05. Children who were frustrated and viewed the violent cartoon (M = 5.55) were rated as playing more aggressively than children in other conditions (M = 1.11, 1.48, 1.54, respectively).