Download
1 / 33
370 likes | 848 Views
The SEMATECH Cost of Ownership Model. Mike Berman U of Arizona. AGENDA. Why use it? How to use it? What if? CoO of a new system Process 1 Vs Process 2 Quality Improvement Tool Summary. Purpose:.

E N D
The SEMATECH Cost of Ownership Model Mike Berman U of Arizona
AGENDA • Why use it? • How to use it? • What if? • CoO of a new system • Process 1 Vs Process 2 • Quality Improvement Tool • Summary
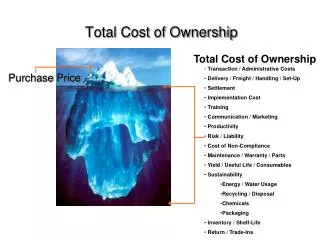
Purpose: • “The SEMATECH Cost of Ownership (SCoO) model was developed to address the economic and productive performance of a tool while operating in pre-production or in production.”
Description: • “The SCoO model is a calculator to perform a cost comparison of options for completing a step in a semiconductor wafer fabrication process”
Why is the SCoO so important? • Manufacturing cost control is critical to survival in the market place. • For cost control you must: • Know the cost of each step • Understand the reasons for these costs • Control and reduce the costs • ASP’s drop each year, So must costs!!!
Why use the SEMATECH Model? • Independent of OEM & the Supplier • Developed by SEMATECH • It is the De Facto standard • It permits “Apple’s to Apple’s comparisons
The SEMATECH Model is NOT • A MEASURE OF THE PROCESS • If the new process does not work or • Has a lower yield, do not waste your time • ABSOLUTE • Able to make tools smaller!
Model Description • The Model is very comprehensive • Up to 90 inputs & 210 output parameters • Can be used with as few as 10 inputs & 1 output • Once understood it produces simple and fast results • The Rewards are enormous: High benefit to effort ratio Detailed insight into the cost makeup of each step “What if” type questions can be addressed • The SCoO is most useful as a comparison tool.
Dos & Do Nots: • Do not “improve” the technique used to find the values • Do “add spreadsheets within the spreadsheet” • See next page for examples
Examples • For sputter Target cost per wafer: • Target Life, Target cost, Avg. process dep • Cost of gas per wafer(Etch/CVD): • Volume & cost of tank • Usage, flow and time (all steps) • Cmp • Pad cost, life(in polish mins or wafers)
Major parts of the Model: • Title: Fill in more detail than you will need! • In 1 year they will all look the same! • VOLUME/THROUGHPUT DATA • EQUIPMENT DATA • PRODUCTION/RUNNING DATA (usage) • MAINTENANCE COSTS • PERSONNEL PER SYSTEM /STANDARD RATES • ANNUAL COST PER GOOD WAFER ($) • MANAGEMENT SUMMARY • PHOTO LITHOGRAPHY WORK SHEET
How to use the SCoO It’s in Excel-not PowerPoint!
Standard Rates • Burdened Salary • Engineer $115,000 • Supervision $100,000 • Operator $30./Hr • Maintenance $35./Hr • Administrative Rates • Insurance 0.47 % • Personal Prop. Tax 1.34 % • Interest 10.0 % • Inflation Rate 3.0 % • Life of Equipment 5 years • Test Wafer Cost $80.00 • Value of incoming $100 to $1400 • Value of completed $1,500.
SURPRISES !! • Capital cost of the equipment may not be the driver for Cost of Ownership • MTBF (>75 hr.) impact on utilization & cost reduction is not as significant as previously thought • Defect density & Line Yield are far more important then previously anticipated • The cost of the wafer at the process step is more important than previously considered
Defect Density • Die area (Line 104) 1 cm2 • Probability of a failure (Line 105) 16.6% • Defect Density (Line 21) Vs Cost of Wafer .01 (defects/cm2) $8.49 .05 $15.06 .10 $23.27 .2 $39.69 .5 $88.95 .9 $154.64
CoO of a “New System” • Use your “best” numbers • Be fair • Use a run rate of Max. (for most models) • This is NOT a measure of the Process • This is only an estimate, your real cost may vary
Process 1 Vs Process 2 • Be Fair • Throughput & Defect Density are the main Drivers. • Use “real” numbers, not specs • If you do not have “Real” Defect Density Data, use “0”.
Quality Improvement Tool • Major use of the Model • Only change key cells • Changes in “Throughput” need changes in “Production requirements” • This can be used for “small changes”
How do I get my copy? • SEMATECH stopped support on 4-15-95. • Now it is call “ TWO COOL” from Wright, Williams, & Kelly • 11875 Dublin Boulevard, Suite D262 • Dublin, CA 94568 • 1-510-803-5880 • Cost $7,190.00 (in 1995)
SUMMARY • You now know more than most users • Use it, work with it • Split your screen, place line 382 at the top of your screen, and make changes and see how they change the total CoO.