Download
1 / 34
340 likes | 609 Views
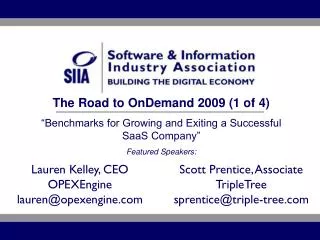
The Road to OnDemand 2009 (1 of 4) “Benchmarks for Growing and Exiting a Successful SaaS Company” Featured Speakers:. Lauren Kelley, CEO OPEXEngine lauren@opexengine.com. Scott Prentice, Associate TripleTree sprentice@triple-tree.com. “The Road to OnDemand” Series.

E N D
The Road to OnDemand 2009 (1 of 4) “Benchmarks for Growing and Exiting a Successful SaaS Company” Featured Speakers: Lauren Kelley, CEO OPEXEngine lauren@opexengine.com Scott Prentice, Associate TripleTree sprentice@triple-tree.com
“The Road to OnDemand” Series “Creating and Sustaining Profitable SaaS Customer Relationships” Tuesday, 9/22/2009 - 12:30pm ET – 1:30pm ET “Marketing 2.0” Tuesday, 9/29/2009 - 12:30pm ET – 1:30pm ET “Hybrid SaaS Markets” Wednesday, 10/7/2009 - 12:30pm ET – 1:30pm ET To register, visit: http://bit.ly/ODwebinars
Benchmarks forGrowing a Successful SaaS Company Lauren Kelley www.opexengine.com
SaaS Operating and Financial Model The subscription business is a numbers game…
Its all about adding customers And decreasing the incremental cost of maintaining a customer
SaaS Sales and Marketing – Private Benchmarks Source: OPEXEngine Confidential Software Operating Benchmarks 2008
Add’l Break-Down of Go-to-Market expenses • Sales expense 38.4% of revenues • Total comp 72.2% of sales expense • T&E 8.5% of sales expense • Marketing expense 19.9% of revenues • Web spending 7.8% of marketing expense, • Lead generation 2% • Travel expense 3.8% • Travel expense 5.8% of revenues (up from 4.5% in 2006) Source: OPEXEngine Confidential Software Operating Benchmarks 2008 Source: OPEXEngine Confidential Software Operating Benchmarks 2008
How profitable are the leaders? Source: OPEXEngine On-Demand Dashboard
Key SaaS Metrics • Contracted Monthly Recurring Revenue (CMRR) • Cash from operations • Net new customers for full year 2008 and first half 2009 • Cost per customer to acquire new customer • Cost per customer to maintain a customer per month • Average contract value per customer • Average increase in number of seats per customer for 2008 and for first half 2009 • Average up-sell in dollar value per customer for 2008 and for first half 2009 • Customer renewal rate during 2008 (as a percent of customers up for renewal during 2008) • Dollar renewal rate during 2008 (as a percent of total $ value up for renewal during 2008) Tracked by OPEXEngine
2009 Confidential Benchmarking Participate Today… • 2008 and 1H 2009 benchmarks: • Income statement and Balance sheet metrics • Detailed expense break-outs • Sales and customer metrics • SaaS specific metrics • Customer support, R&D and Product metrics • Headcounts by total company, individual departments and geographies • Receive an Individual Company Report comparing your company data against 5-6 peer groups (by revenue size, business model, ownership – public versus private, type of customers, growth expectations) • Receive the 2009 Industry Report with all benchmarks and all peer groups • Open for participation through September 15, 2009 • Pricing: $999 for companies with revenues less than $10M; $2500 for companies with revenues between $10M-$100M; and $3500 for companies with revenues over $100M www.opexengine.com lauren@opexengine.com
Special Benchmarking Promotion • For any webinar participant – receive the following 3 benchmarks for free if you participate fully in the survey: • Total compensation and benefits expense as a percent of Recognized Revenue • Sales expense as a percent of Recognized Revenue • Cost per customer to acquire a new customer • To participate for the free benchmarks, contact me directly at lauren@opexengine.com • Full benchmarking reports available to participants at normal charges; SIIA members receive a 20% discount.
Founded end of 2006 • Decades of general management, sales, marketing and operating experience • Develop comprehensive operating and financial benchmarks – best data available for software industry • Deliver well defined industry comparables to senior executive teams and boards www.opexengine.com 617-674-4218
Confidential Software Operating Benchmarks – Customers “The data and benchmarks in OPEXEngine’s Confidential Software Benchmarking Report is not available from any other source and covers both private and public software companies with a variety of business models. The report and data are extremely well put together. It gave us great insights into our own software business and was the basis for a critical presentation to senior management on our strategy going forward. I highly recommend OPEXEngine’s operating benchmarks to any software executive of a large or small company.” Charles Gerlach, Director Business Operations, Software Practice, Sun Microsystems
OPEXEngine On-Demand Dashboards with EDGAR Online Download in minutes Excel-based reports on US public company financials with operating ratios already computed: any company, any time period, current to 10 years back "On-Demand Dashboards is a great service that allows me to easily benchmark our performance vs. others in our industry. I track the quarterly financials for several key companies in the software sector using a spreadsheet that I built myself, but compiling the data made the analysis virtually impossible to maintain. The On-Demand Dashboards service takes all that headache away and in 5 minutes I can put together a great report to present at our Board meeting." Todd Palmieri, CFO of Boomi
SaaS is a “Game Changer” in Technology, Consulting, and Outsourcing • Overview • Maturation Underway: SaaS vendors by definitions are specialists, but platforms are emerging • Wake Up Calls Answered: Household name tech firms are now becoming SaaS contenders • New Entrants: Non-traditional firms (Consumer, Retail, Web) are paving inroads into traditional tech strongholds • Best Exits: M&A to both traditional and non-traditional acquirers • Leaders: Best-of-breed private companies (<$25M Revenue) are relevant to $1B franchises • Looking ahead: “Convergence” • Pioneering privately-held companies • Evolution of ISVs to on-demand • BPO leveraging on-demand for higher-margin outsourcing • Entrance of new players (non-traditional); the “Google effect” • Key Trends – Analytics • Automated decision making is becoming more and more challenging as businesses seek deeper insight and predictive knowledge for smarter business outcomes • Currently a fragmented market, emerging players are taking advantage of industry verticals that are investing in solutions to help better predict future business • Key Trends – Collaboration • Leading enterprise vendors are expanding their collaboration capabilities and integrating workflow tools into existing software platforms – IBM and Microsoft are prime examples • Global enterprises beginning to realize the efficiency gains brought about by the implementation of compliance toolsets Spotlight Research Annual Market Synopsis
A “Separation from the Pack” is Starting to Occur for SaaS Firms • Of the 2,200 SaaS firms TripleTree tracks, 90% have less than $15m GAAP revenue • Many are growing 25%+ • Margin expansion with multi-tenant benefits • 2007 was a major turning point • 2009 – 2010 will be another key period EBITDA Margin Top 10% of SaaS firms Revenue Growth Source: TripleTree, CapitalIQ (1) Based on TripleTree’s database of 2,200+ Software as a Service firms. * Denoted by logos: Public Co’s or S-1 Filed * All figures reflect fiscal year financial data
Capital Markets Continue to Reward Recurring Revenue and SaaS Business Models Stock performance for the on-demand index continues to be strong. TripleTree’s public Software as a Service index consists of the firms listed below; although, the sector is defined by private companies with TripleTree’s Software as a Service database consisting of more than 2,200 firms. Relative Performance (%) On-demand premium Source: TripleTree, CapitalIQ
Performance of Companies Over $100m in Revenue vs Companies With Less than $100m % Change Commentary… Stock Performance • Software as a Service typically spawns “specialists” vendors who gravitate towards platforms • The firms over $100m in revenue are trading at premiums • Industry still dominated by Salesforce.com, Omniture, Blackboard, and Concur which account for 30% of the $6b industry Relative Performance $100m (+) 28% $100(+) above $100 (-) 13% $100 (+) above S&P 500 $100m (-) $100m (+) $100m (-) $100 (-) below S&P 500 (15%)
Performance of Subscription vs Transaction-based Models % Change Stock Performance Commentary… • Subscription Model: • Monthly or yearly subscription fee for usage (ex. Salesforce.com’s $50/user per month • Revenue far more predictable, • Excellent visibility to future revenue • Transaction Model: • Click charge or pay as you use (ex. DealerTrack’s $5/per usage fee) • Revenue less predictable • Most solutions are “sticky” with high customer retention rates • Companies typically have some visibility to future revenue projections either through customer usage built into contracts or monthly minimums Relative Performance Subscription 28% Subscription above transaction 17% Subscription above S&P 500 Transaction Subscription Transaction Transaction below S&P 500 (11%)
TEV/Revenue Performance % Change Commentary… Revenue Size • Difficult global economic conditions, tighter credit markets and political uncertainty are weighing heavily on the capital markets. • Every sector is being impacted • Software as a Service remains a “hot” topic, however valuations have dropped from highs of late 2007 • The SaaS market is sized at $6b today and is projected to reach $15B in 2011 (1) Revenue • High: • 9.2x • October 2007 • Low: • 1.4x • November 2008 • Current: • 2.2x - 3.0x TEV/Revenue SaaS IPO Boom inflated multiples Delivery Model Delivery Model • High: • 12.7x • October 2007 • Low: • 1.9x • November 2008 • Current: • 2.8x – 3.5x October Scare February Bottom TEV/Revenue (1) Credit Suisse
Analysis of Recent SaaS Transactions Recent M&A comps & TripleTree’s proprietary scoring system provide a glimpse into the drastic fluctuations in valuation. 6 Categories of 40 Criteria Vertical Focus Architecture & Ecosystem Scalability Recurring Revenue Market Leader Growth Profitability Seller Description P/R Date Buyer Seller TripleTree Represented
TripleTree’s View on the Marketplace • IPO market continues to be stagnant • Tighter economic times and political uncertainty have weighed on the capital markets and M&A climate • More difficult credit markets have shifted M&A from an equal weighting between strategic acquirers and private equity firms back primarily to strategic acquirers • Middle market M&A climate remains solid since most acquirers need to make acquisitions to deliver growth • Recurring business models – like Software as a Service – remains a “hot” topic and receives premium valuations • Benchmarking successful firms takes on a new importance as vendors struggle to differentiate and grow
Q&A *Lauren Kelley, CEO, OPEXEngine lauren@opexengine.com *Scott Prentice, Associate, TripleTree sprentice@triple-tree.com