Download
1 / 23
230 likes | 578 Views
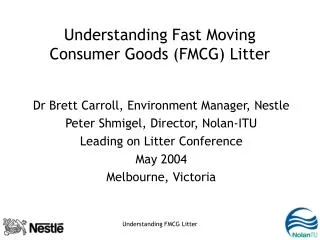
Understanding Fast Moving Consumer Goods (FMCG) Litter. Dr Brett Carroll, Environment Manager, Nestle Peter Shmigel, Director, Nolan-ITU Leading on Litter Conference May 2004 Melbourne, Victoria. Today’s Presentation. Explain Nestle’s reasons for involvement in littering issue

E N D
Understanding Fast Moving Consumer Goods (FMCG) Litter Dr Brett Carroll, Environment Manager, Nestle Peter Shmigel, Director, Nolan-ITU Leading on Litter Conference May 2004 Melbourne, Victoria Understanding FMCG Litter
Today’s Presentation • Explain Nestle’s reasons for involvement in littering issue • Outline path that Nestle is following • Overview research outcomes by Nolan-ITU for Nestle • Introduce a model for prioritisation of FMCG litter • Comments on improving littering management Understanding FMCG Litter
Nestlé - Background • Founded in 1866 in Switzerland - largest Food and Beverage company in the world • Factories or operations in almost every country on earth • Set up business in Australia in 1908 and now 2nd or 3rd largest F&B company in Australia • DID YOU KNOW? - MILO was a uniquely Australian invention in 1934, now sold in over 30 countries worldwide Understanding FMCG Litter
Nestlé in Australia Understanding FMCG Litter
Market Background • Fast moving consumer goods (FMCG): • purchased from retail for immediate consumption • consumer: low cost, low commitment, frequent purchases • industry: high volume, low margin • Nestle FMCGs: confectionery, yoghurt, ice cream, and beverages • Changing demographics • smaller households • more ‘away-from-home’ consumption • smaller, convenience oriented packs Understanding FMCG Litter
Nestle Reasons for Involvement • Social / market factors leading to higher probability of littering of FMCGs • Corporate citizenship and environmental management goals • National Packaging Covenant participation • Broadening of Nestle’s environmental management program from internal operations focus to product life cycle • Risk management: public policy, reputation, brand Understanding FMCG Litter
Nestle Pathway 1. Better understanding of scope and nature of littering of FMCGs • What’s the size and scale of the problem? • What currently works in managing it? 2. Open dialogue and co-operation • Australian Food & Grocery Council Enviro Committee • anti-littering stakeholders, including VLAA 3. Implementation actions - some still being identified - Eco-Design Guidelines (in Covenant Action Plan) Understanding FMCG Litter
Scoping the Problem • Nestle engaged Nolan-ITU: • conduct desktop review of existing litter data • generate preliminary estimate of Nestlé products in litter stream • examine quality of existing litter data on food and grocery products • prioritise litter items • outline current anti-littering initiatives Understanding FMCG Litter
Process • Determine value of FMCGs (industry data) • Determine value of consumed away-from-home (AFGC estimate) • Assign $2 per item (Nolan-ITU assumption) • Determine potential litter items (CCC/BIEC data) • Estimate # of FMCG litter items (KABC data) • Estimate % of Nestle litter items (industry data) • Prioritise Nestle litter items by significance (Nolan-ITU methodology) Understanding FMCG Litter
Nestle products as proportion / # in litter stream NESTLE 3% 50 million littered units FMCG 33% 496 million littered units REMAINING 64% 963 million littered units
Data Characteristics • No “national” count since 1996 • Previous to today, no public estimate of total size of litter stream or actual % of FMCGs in litter stream • Brand names generally unrecorded • Inconsistent recording of packaging types • Geographical dispersion not well established Understanding FMCG Litter
Process - another way of thinking • Determine potential litter items (2003 KESAB) • Extrapolate number of equivalent litter collection sites across Australia • Multiply by average number of items collected per site • Multiply from a quarterly to a yearly equivalent • Est. size of total litter stream = 622 m. items • Apply estimated 23% of FMCG litter items (2003 KESAB) • account for differences in beverages due to CDL • Est. size of FMCG litter stream = 141 m. items Understanding FMCG Litter
FMCG Litter: How Significant? • Major advances in understanding factors that contribute to littering • Less understanding of actual impact of litter (with exception of some work on direct financial cost of management) • Critical to estimate impacts in order to guide program priorities Understanding FMCG Litter
NUMBER OF LITTERED ITEMS X AREA X PERSISTENCE DIRECT LITTER INDICATOR = Direct Litter Indicator (DLI) • Indicates the immediate, objective and quantifiable aspects associated with litter from a packaging type • Area (m2) – Maximum area of ground covered by FMCGs littered items • Persistence (years) – Estimated amount of time litter remains in the environment Understanding FMCG Litter
Direct Litter Indicator (DLI) • Results for key Nestle items: • Confectionery wrappers = 7.86 • Ice cream wrappers = 2.89 • Yogurt containers = 0.17 • “Other” beverage bottles = 0.06 • Ice cream sticks = 0.02 • Bottle tops = 0.0036 Understanding FMCG Litter
DIRECT LITTER INDICATOR X ENVIRONMENTAL IMPACT X RISK LEVEL CUMULATIVE LITTER INDICATOR = Cumulative Litter Indicator (CLI) • Adds the dimensions of: • Environmental impact - in terms of ecosystem impact (primarily impacts on wildlife) and human toxicology (through emissions to water, air and soil); • Risk Level – in terms of the likelihood and severity of regulatory intervention and brand reputation damage. Understanding FMCG Litter
CLI Example -Confectionery Wrapper • DLI = 7.86 • Environmental impact = 2 • ecosystem impact = 1 and human toxicity = 1 • Risk level = 2 • Regulation = 1 and reputation = 1 • CLI = 7.86 x 2 x 2 • CLI = 31.44 Understanding FMCG Litter
Cumulative Litter Indicator (CLI) (cont) • Results for key Nestle items: • Confectionery wrappers = 31.44 • Ice cream wrappers = 8.67 • Yogurt containers = 0.17 • “Other” beverage bottles = 0.18 • Ice cream sticks = 0.02 • Bottle tops = 0.01 Understanding FMCG Litter
Comparative example • Confectionery wrappers • Amount = 28 million • Area = 0.23m • Persistence = 1y • DLI = 6.44 • Enviro impact = 2 • Ecosystem impact =1 • Human impact = 1 • Risk impact = 2 • Regulation = 1 • Reputation = 1 • CLI = 25.76 • Beverage containers • Amount = 28 million • Area = 0.13m • Persistence = 5y • DLI = 17.90 • Enviro impact = 2 • Ecosystem impact=1 • Human impact = 1 • Risk impact = 3 • Regulation = 1.5 • Reputation = 1.5 • CLI = 107.4 Understanding FMCG Litter
Insights • Attempting to quantify problem creates impetus for action by company, industry & stakeholders • Prioritisation of items enables better targeting of efforts • Strong need for broadly accepted, consistent and “official” litter measurement methodologies • Collaborative approaches - on VLAA model - necessary Understanding FMCG Litter