Download
1 / 45
450 likes | 473 Views
Explore the different types of networks, their properties, and measurement techniques. Understand the concept of random graphs and power-law distributions.

E N D
Statistical Properties of Massive Graphs (Networks) Networks and Measurements
What is an information network? • Network: a collection of entities that are interconnected • A link(edge)between two entities (nodes) denotes an interaction between two entities • We view this interaction as informationexchange, hence, Information Networks • The term encompasses more general networks
Why do we care? • Networks are everywhere • more and more systems can be modeled as networks, and more data is collected • traditional graph models no longer work • Large scale networks require new tools to study them • A fascinating “new” field (“new science”?) • involves multiple disciplines: computer science, mathematics, physics, biology, sociology. economics
Types of networks • Social networks • Knowledge (Information) networks • Technology networks • Biological networks
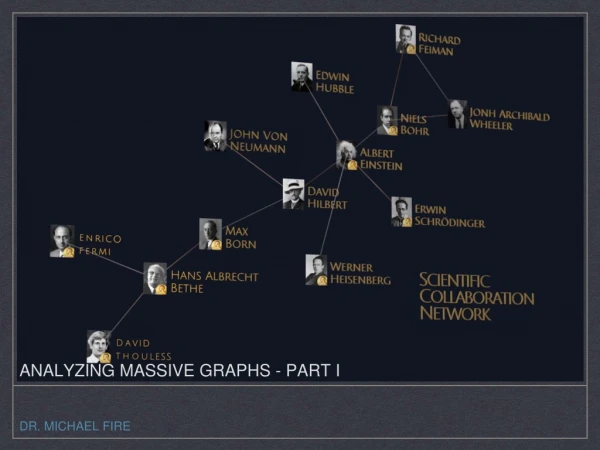
Social Networks • Links denote a social interaction • Networks of acquaintances • actor networks • co-authorship networks • director networks • phone-call networks • e-mail networks • IM networks • Microsoft buddy network • Bluetooth networks • sexual networks • home page networks
Knowledge (Information) Networks • Nodes store information, links associate information • Citation network (directed acyclic) • The Web (directed) • Peer-to-Peer networks • Word networks • Networks of Trust • Bluetooth networks
Technological networks • Networks built for distribution of commodity • The Internet • router level, AS level • Power Grids • Airline networks • Telephone networks • Transportation Networks • roads, railways, pedestrian traffic • Software graphs
Biological networks • Biological systems represented as networks • Protein-Protein Interaction Networks • Gene regulation networks • Metabolic pathways • The Food Web • Neural Networks
Now what? • The world is full with networks. What do we do with them? • understand their topology and measure their properties • study their evolution and dynamics • create realistic models • create algorithms that make use of the network structure
Erdös-Renyi Random graphs Paul Erdös (1913-1996)
Erdös-Renyi Random Graphs • The Gn,p model • n : the number of vertices • 0 ≤ p ≤ 1 • for each pair (i,j), generate the edge (i,j) independently with probability p • Related, but not identical: The Gn,m model
Graph properties • A property P holds almost surely (or for almost every graph), if • Evolution of the graph: which properties hold as the probability p increases? • Threshold phenomena: Many properties appear suddenly. That is, there exist a probability pc such that for p<pc the property does not hold a.s. and for p>pcthe property holds a.s.
The giant component • Let z=np be the average degree • If z < 1, then almost surely, the largest component has size at most O(ln n) • if z > 1, then almost surely, the largest component has size Θ(n). The second largest component has size O(ln n) • if z =ω(ln n), then the graph is almost surely connected.
The phase transition • When z=1, there is a phase transition • The largest component is O(n2/3) • The sizes of the components follow a power-law distribution.
Random graphs degree distributions • The degree distribution follows a binomial • Assuming z=np is fixed, as n→∞ B(n,k,p) is approximated by a Poisson distribution • Highly concentrated around the mean, with a tail that drops exponentially
Random graphs and real life • A beautiful and elegant theory studied exhaustively • Random graphs had been used as idealized generative models • Unfortunately, they don’t capture reality…
Measuring Networks • Degree distributions • Small world phenomena • Clustering Coefficient • Mixing patterns • Degree correlations • Communities and clusters
Degree distributions • Problem: find the probability distribution that best fits the observed data frequency fk = fraction of nodes with degree k = probability of a randomly selected node to have degree k fk k degree
Power-law distributions • The degree distributions of most real-life networks follow a power law • Right-skewed/Heavy-tail distribution • there is a non-negligible fraction of nodes that has very high degree (hubs) • scale-free: no characteristic scale, average is not informative • In stark contrast with the random graph model! • highly concentrated around the mean • the probability of very high degree nodes is exponentially small p(k) = Ck-α
Power-law signature • Power-law distribution gives a line in the log-log plot • α : power-law exponent (typically 2 ≤ α≤ 3) log p(k) = -α logk + logC α log frequency frequency log degree degree
Examples Taken from [Newman 2003]
Maximum degree • For random graphs, the maximum degree is highly concentrated around the average degree z • For power law graphs • Rough argument: solve nP[X≥k]=1
Exponential distribution • Observed in some technological or collaboration networks • Identified by a line in the log-linear plot p(k) = λe-λk log p(k) = - λk + log λ log frequency λ degree
Clustering (Transitivity) coefficient • Measures the density of triangles (local clusters) in the graph • Two different ways to measure it: • The ratio of the means
Example 1 4 3 2 5
Clustering (Transitivity) coefficient • Clustering coefficient for node i • The mean of the ratios
Example • The two clustering coefficients give different measures • C(2) increases with nodes with low degree 1 4 3 2 5
Clustering coefficient for random graphs • The probability of two of your neighbors also being neighbors is p, independent of local structure • clustering coefficient C = p • when z is fixed C = z/n =O(1/n)
Small world phenomena • Small worlds: networks with short paths Stanley Milgram (1933-1984): “The man who shocked the world” Obedience to authority (1963) Small world experiment (1967)
Small world experiment • Letters were handed out to people in Nebraska to be sent to a target in Boston • People were instructed to pass on the letters to someone they knew on first-name basis • The letters that reached the destination followed paths of length around 6 • Six degrees of separation:(play of John Guare) • Also: • The Kevin Bacon game • The Erdös number • Small world project: http://smallworld.columbia.edu/index.html
Measuring the small world phenomenon • dij = shortest path between i and j • Diameter: • Characteristic path length: • Harmonic mean
Mixing patterns • Assume that we have various types of nodes. What is the probability that two nodes of different type are linked? • assortative mixing (homophily) E : mixing matrix p(i,j) = mixing probability p(j | i) = conditional mixing probability
Mixing coefficient • Gupta, Anderson, May 1989 • Advantages: • Q=1 if the matrix is diagonal • Q=0 if the matrix is uniform • Disadvantages • sensitive to transposition • does not weight the entries
Mixing coefficient • Newman 2003 • Advantages: • r = 1 for diagonal matrix , r = 0 for uniform matrix • not sensitive to transposition, accounts for weighting (row marginal) (column marginal) r=0.621 Q=0.528
Degree correlations • Do high degree nodes tend to link to high degree nodes? • Pastor Satoras et al. • plot the mean degree of the neighbors as a function of the degree • Newman • compute the correlation coefficient of the degrees of the two endpoints of an edge • assortative/disassortative
Communities and Clusters • Use the graph structure to discover communities of nodes • essentially clustering and classification on graphs
Other measures • Frequent (or interesting) motifs • bipartite cliques in the web graph • patterns in biological and software graphs • Use graphlets to compare models [Przulj,Corneil,Jurisica 2004]
Other measures • Network resilience • against random or targeted node deletions • Graph eigenvalues
Other measures • The giant component • Other?
References • M. E. J. Newman, The structure and function of complex networks, SIAM Reviews, 45(2): 167-256, 2003 • M. E. J. Newman, Random graphs as models of networks in Handbook of Graphs and Networks, S. Bornholdt and H. G. Schuster (eds.), Wiley-VCH, Berlin (2003). • N. Alon J. Spencer, The Probabilistic Method