Download
1 / 1
10 likes | 100 Views
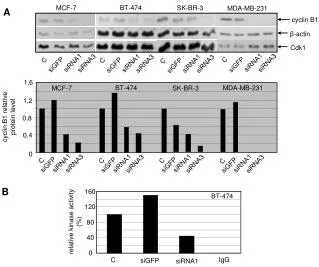
This study examines the effects of siRNA silencing on cyclin B1 protein levels and kinase activity in BT-474, MCF-7, SK-BR-3, and MDA-MB-231 breast cancer cell lines. Results show differential regulation of cyclin B1 expression and kinase activity post-siRNA treatment.

E N D
Fig. 1 BT-474 MCF-7 SK-BR-3 MDA-MB-231 A β-actin cyclin B1 C C C C Cdk1 siRNA1 siRNA1 siRNA1 siRNA1 siRNA3 siRNA3 siRNA3 siRNA3 siGFP siGFP siGFP siGFP BT-474 MDA-MB-231 MCF-7 SK-BR-3 1,6 cyclin B1 relative protein level 1,2 0,8 0,4 0 B 160 BT-474 C C C C siRNA1 120 siRNA1 siRNA1 siRNA3 siRNA1 siRNA3 siRNA3 siRNA3 siGFP siGFP siGFP siGFP relative kinase activity (%) 80 40 0 IgG C siGFP siRNA1