Getting Started with XFDTD: A Comprehensive Guide
This tutorial, written by Cynthia Furse from the University of Utah, provides an in-depth introduction to using XFDTD, a 3D Finite Difference Time Domain simulation software developed by Remcom, Inc. Learn how to create geometry and FDTD files for simulation, define your materials, and understand the simulation parameters and settings. Step-by-step instructions include geometry creation, material property editing, and simulation execution. Perfect for both beginners and experienced users looking to enhance their skills in electromagnetic simulations.

Getting Started with XFDTD: A Comprehensive Guide
E N D
Presentation Transcript
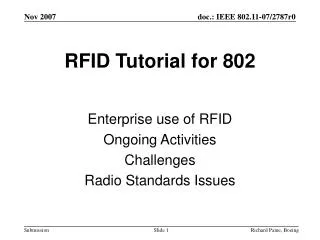
Tutorial for XFDTD Written by Cynthia Furse University of Utah
XFDTD • 3D Finite Difference Time Domain code • Written by Remcom, Inc. • http://www.remcom.com
To start XFDTD in the CADE Lab • type 'xfdtd53' in a shell. * Suggestion: First open the folder where you want your XFDTD file in.
Geometry File XFDTD uses two file types for any simulation. The Geometry file contains information about grid spacing and size, material types, and the location of objects in the grid. Its extension is ".id". The other file type is the fdtd file. This file contains all simulation paramenters, including the location of sources, number of timesteps, and data to be saved during the simulation. To run a simulation, a Geometry file has to be created. After the Geometry file has been saved, an fdtd file needs to be created. The fdtd file automatically references the geometry file that was open when it is created. After the fdtd file is created and saved, calcfdtd can be run. The data will be stored in the directory that xfdtd was opened in. After the simulation run is complete, the fdtd file needs to be reloaded into xfdtd for data to be viewed and plotted.
Define the FDTD Grid This means you will be defining the materials at the locations of the E field components Total Space (model plus surrounding air) Cell Size
This will show you the grid. So far it contains only air. Location of your cursor Orientation. You are viewing the xy-plane. Zoom Factor Where in the plane.(layer#)
To change the plane you are viewing: ZY plane XY plane ZX plane 3D view
Add Electrical Materials Double select ADD Then, choose Next Available or Choose Color * Disabled “Num Lock” in your computer keyboard, if double click cannot process.
Edit Electrical Properties of the Materials to be in your model Enter your material e r s Material 0=air Material 1 = PEC (metal) Lookup the material properties for your material. Only needed when computing SAR
Edit the Color for Your Material If you click Choose Color instead of Next Available:
Here are Several Model Elements Choose Material Blocks of Plate and Cube Types of Single-Cell Models Wire Plate Cube Build Layers above or below
Start to Define Your Geometry Choose Material
Let’s Start with a Single-Cell “Wire” made of Material 2, What I Named Substrate
Electric Grid Lines Represent Each Ex,Ey,Ez Component…(The Grid has also been Zoomed) This means the Ex component is “in” material 2 (but the Ey,Ez components are in material 0=air) Ez is in Material 2 Ey is in Material 2 Ey Ez Ex Each Cell has Ex, Ey, Ez components
See How a Cube of Material is Defined in this layer: Ez Ez Ex Ey Ey Ex Ez Ez
No Ez’s Ex Ey Ey Ex And in the Layer Above it * To erase or undo, use Free Space in Electrical Materials to cover.
Alternatively we could have used rectangular box in the library. Hold Middle Mouse Button to Drag, Click Left Button to Build. Draw the Teflon Box for Patch Antenna on Slice 25
Add Another Layer Slice 26 * Or in Geometry Editing Tools, add number of layers in Additional Layers for above or below levels.
And Another Layer Slice27
But we want the top of the patch antenna to be metal, so choose the plate element PEC
Slice 25 Add a plate to the bottom, too. (We used the plate instead the cube to draw layers of PEC, therefore, it’s on the same layer with Taflon)
Look at this “sandwich” in the yz and xz planes If the plates and boxes aren’t lined up correctly, fix them
(27,23,28) We want to add a feedpoint to the center of the patch. Use the cursor to find where this is.
Y=23 Look at the feed location (Make sure that’s your feedpoint when you put your cursor at your feed Location) View-XZplane
Use these wires to connect top to bottom plate, leaving one cell gap for voltage feed source 2 single-cell wires in the z (vertical) direction gap
Find the Location of the Feed Point Gap with the Cursor The location to put your source need to be one grid below the feedpoint because the source take one grid space. We put our cursor at the gap. (27,23,27)
Save Your Geometry • Now you have created your geometry file • You have found where to put your source • Save your geometry as ~.id file
Types of Simulations Steady State Steady state simulations use the sinusoid source found in the FDTD - Run Paramenters - Voltage Source menu. This is very useful to determine exact parameters of an object at the specified input frequency. This includes SAR values, efficiency, radiation patterns, and input impedance. Many of these values can be found by simply looking at the Steady State Option in the Plot menu. Transient Transient simulations are excellent for determining the general paramaters of an antenna over a range of frequencies. Transient simulations use a gaussian pulse, or one of its variations as a source. By running a transient simulation. One can easily determine the input impedance over a large frequency range. This allows you to find the resonant frequency of an antenna, and gives you the information needed to make changes to your design.
Choose a Source and “Add Port to List”. You may have several sources. They Can be edit in “Set Waveform” This is your feedpoint location If you want to S-paramters results
A note on # of Time Steps For steady state simulations, enough time steps must be included to reach steady state conditions. Otherwise, the results will be invalid. To determine if convergence has been reached. Store near zone values. Look at the near zone values to determine if Steady State has been reached. For transient simulation, more time steps will allow larger FFT transforms. This will give plots more data points, giving smoother graphs.
The source location will only show when the source window is open. Close the Source Window, and Reopen It to see the source location on your grid.
These are available for pulsed FDTD Other values of interest are available for sine wave source only Define what you want FDTD to save after calculation
If you want to see EM fields, select yes, and you will be impressed This is what is displayed Start simulation
XY Plane of EM Field You can change the Plane and view fields in Different direction
Display Results • When Simulation is Finished, Reopen the • .fdtd file again, then display the result.
You can edit your plot parameters here Simulation S-parameters Results Then Click First Click
You can see the resonance frequency of this antenna is around 1.1GHz S11 Response