Download
1 / 12
120 likes | 302 Views
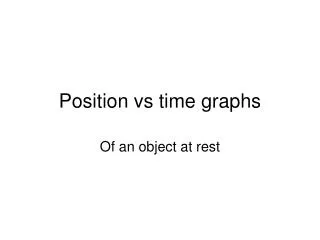
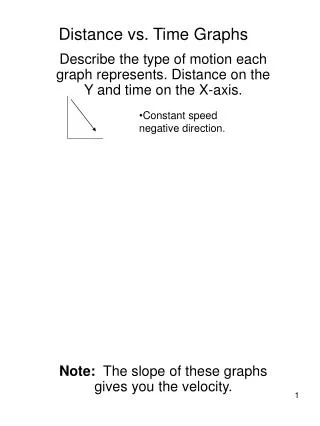
Disp. Vs. Time. 0. Q1:What kind of motion is described by the graph above? Q2: Draw a Velocity Vs. Time graph which represents the same motion. Velocity vs. Time. 0. Q1: Draw an Acceleration vs. Time graph which indicates the same motion. Acceleration vs. Time. 0.

E N D
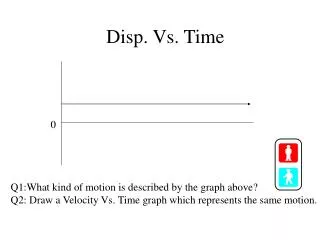
Disp. Vs. Time 0 Q1:What kind of motion is described by the graph above? Q2: Draw a Velocity Vs. Time graph which represents the same motion.
Velocity vs. Time 0 Q1: Draw an Acceleration vs. Time graph which indicates the same motion.
Acceleration vs. Time 0 Q1: Draw a Velocity vs. Time graph which represents a constant positive velocity.
Velocity vs. Time 0 Q1: Draw a V vs. T graph which indicates a constant negative velocity. Q2: Draw a D vs. T graph which indicates a constant negative velocity as well.
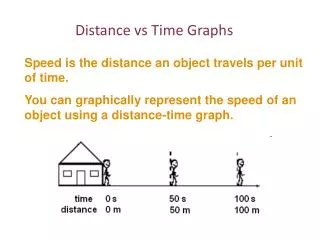
D Vs. T and V Vs. T Q1: Draw both a D vs. T and V vs. T graph for a constant negative velocity of even greater magnitude. Q2: What does the slope of a D vs. T graph indicate?
D vs. T and V vs. T A2: The slope of D vs. T graph indicates VELOCITY. Q1:Draw D Vs. T and V vs. T graphs which indicate a large positive velocity.
D vs. T and V vs. T Q1:Draw an Acceleration vs. Time graph which indicates a large positive velocity.
Acceleration vs. Time 0 Q1: Draw D vs. T and V vs. T graphs which indicate an increasing positive velocity.
D vs. T and V vs. T Q1:Draw an Acceleration vs. Time graph which indicates an increasing positive velocity.
Accel vs. Time 0 Q1:Given the following V vs. T graph,show the corresponding Accel vs. T graph.
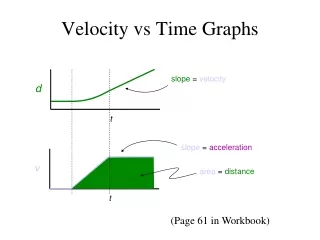
A1: Conclusions: The slope of a Displacement vs. Time graph indicates velocity. The slope of a Velocity vs. Time graph indcates acceleration.
PracticeIn each row, given one of the graphs, complete the other two corresponding to the same motion. D V A