Download
1 / 59
590 likes | 731 Views
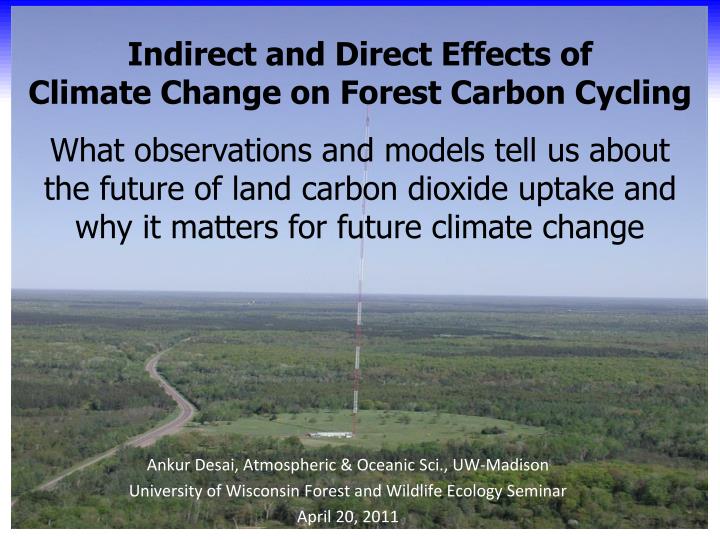
Indirect and Direct Effects of Climate Change on Forest Carbon Cycling What observations and models tell us about the future of land carbon dioxide uptake and why it matters for future climate change. Ankur Desai, Atmospheric & Oceanic Sci., UW-Madison

E N D
Indirect and Direct Effects of Climate Change on Forest Carbon Cycling What observations and models tell us about the future of land carbon dioxide uptake and why it matters for future climate change Ankur Desai, Atmospheric & Oceanic Sci., UW-Madison University of Wisconsin Forest and Wildlife Ecology Seminar April 20, 2011
Forests in the Earth System • Climate system is driven by • Forcings that impact the energy budget, water cycle, or trace gas and aerosol composition of atmosphere • Feedbacks that reverse, limit, or enhance these forcings • Forests have low albedo, moderate evapotranspiration rates, and high carbon stores. They also cover a significant area of the global land surface • Consequently, forcings and feedbacks imposed by forests are worth considering!
Forests in the Earth System Biogeophysical Mechanisms Biogeochemical Mechanisms Radiation CO2 LHF CH4 Ozone, N20 ,Others SHF
Forests in the Earth System Bonan et al., 2008
Hypothesis • The indirect sensitivity and feedbacks of forest carbon cycle to climate change may dwarf the direct sensitivity • Direct effects • Indirect effects • Contemporary observations of forest carbon exchange can be used to evaluate and improve predictive simulation models
What Do We Know? IPCC, 4th AR, (2007)
What Do We Know? Source: Lüthi et al (2008), CDIAC, & Wikimedia Commons 385 ppm (2008) CO2 (ppm) 232 ppm Ice ages Years Before Present
What Do We Know? Since 1990: • Global annual CO2emissions grew 25% to27,000,000,000 tons of CO2 • CO2 in the atmosphere grew 10% to 385 ppm • At current rates, CO2 is likely to exceed 500-950 ppm sometime this century • But: Rate of atmospheric CO2 increase is about half the rate of emissions increase. Why?
Where is the Carbon Going? Houghton et al. (2007) Ecosystem Carbon Sink
Where is the Carbon Going? Le Quére et al., 2009
Where is the Carbon Going? C. Williams, Clark U, NACP 2011
What Don’t We Know? • Sitch et al., 2008
What Don’t We Know? • Friedlingstein et al., 2006
What Don’t We Know? • Ricciuto et al., in prep Ricciuto et al., PhD dissertation
Is There Any Consistency to What We Don’t Know? 47 Flux Tower Sites 30 Models 36 AmeriFlux 11 Fluxnet Canada 24 submitted output 10 runs per site Schwalm et al., 2010
A Little Bit Annual • Error peak at diurnal & annual time scales • Errors at synoptic & monthly time scales Month Diurnal Synoptic Not Significant Dietze et al., in review
N America is in Demographic Transition Pan et al., 2011
WE ARE HERE N America is in Demographic Transition UNEVEN-AGED (maple, oak, pine) Succession ASPEN MORTALITY natural senescence, pathogens, insects EVEN-AGED (mostly aspen) Forest age (years) Courtesy P. Curtis
Disturbance Frequency is Poorly Constrained • Fire: 40,000 km2/year • Harvest: 50,000 km2/year • Insects: larger • Storms/hurricanes: > 17,000 km2/year • Disease: ???
Find the Surprise! Atm. Chem, O3 Precipitation Temperature GHGs Aerosols NOx Heat VOCs H2O CO2 Ecosystems
Direct Effects • Gross Primary Productivity (GPP) • PAR, VPD, T, Qsoil, [CO2], Navail • Ecosystem Respiration (ER) • T, Qsoil, C:N
The Value of Network Science • Ecology is a “synthesis” science Carpenter et al., 2009 Dept of Energy, ORNL
Temperature and Dryness Explain Most NEE Variation Across Space Yi et al., 2011, ERL
Some Convergence of GPP Baer et al., 2010, Science
GPP Controls Are Understood? Baer et al., 2010, Science
Respiration Sensitivity Converges? • Low-frequency component of respiration sensitivity to temperature is consistent across space Mahecha et al., 2010, Science
Indirect Effects • Lagged or coupled responses of climate to carbon uptake • Temporal/spatial lags: Phenology, hydrology • Forest dynamics (recruitment, mortality, growth): Successional trajectory • Disturbance frequency/intensity
Phenology Explains GPP, too! Richardson et al. (2009) Later springs lead to lower productivity in U.S. northeastern forests Onset of Spring Anomaly (Days)
Models Overpredict Growing Season Length Early spring/late fall uptake means positive GPP bias Richardson et al., submitted
What About at the Regional Scale? • Chequamegon Ecosystem-Atmosphere Study (ChEAS)
Coherent Carbon Sinks Imply Climatic Forcing of Interannual Variability Desai et al., 2010
Model-Data Assimilation Shows Predictive Skill with Phenology Short-term only assimilation Short and long term assimilation Desai et al., 2010
Even When Model is Forced to Maintain Coherent Phenology Desai et al., 2010
But Model Explains Coherent Flux Differently Depending on Ecosystem Desai et al., 2010
Phenology is Not Simple! • Niwot Ridge Ameriflux subalpine fir/spruce • 3050m elevation Hu et al. (2010), Sacks et al. (2006)
Moisture Matters Hu et al. (2010)
Snow Water Drives Productivity Soil sfc Rain Soil 35 cm Groundwater Snowmelt WATER SNOW Hu et al. (2010)
Speaking of Hydrology Sulman et al. (2010)
Do Models Get This? • Six model intercomparison • Residuals = Modeled flux – Observed flux a) ER residuals b) GPP residuals Sulman et al., in prep
Water Table is a Critical Model Element Sulman et al., in prep
What About Longer Time Scales? Disturbance Chronosequences with Annual NEP measured by eddy covariance Fire = 4 Harvest = 7+ Insects = 3 Hurricane Wilma Amiro et al., 2010
Rapid Carbon Sink Recovery Post-Fire Amiro et al., 2010
Consistent Ratio of GPP/ER With Age Ra = 0.55*GPP Asymptote = 1.23 Amiro et al., 2010
Bugs Are Complicated! Amiro et al., 2010 CFS web page
Extensive Bark Beetle Tree Mortality Suggests Large Impacts to C cycle… Raffa et al., BioScience, 2008
Growth Reduction Decreases NEP Usually a temporary phenomenon Hicke et al. in revision
Tree Mortality Decreases NEP Hicke et al. in revision
Mortality Recovery Drives Flux Response Hicke et al. in revision