Download
1 / 19
190 likes | 322 Views
This lecture explores the intricacies of membrane transport, focusing on lipid bilayers as dynamic entities characterized by diverse distributions of phospholipid groups. The behavior of lipids at the air-water interface and their interactions with surfactants and other molecules are analyzed. The lecture covers Fick’s Law of diffusion, examining how random motion optimizes entropy, alongside phase transitions in phospholipids like DPPC and DOPC. By integrating concepts of electrostatic potential and diffusion coefficients, it highlights the effects of time and distance on concentration gradients in biological systems.

E N D
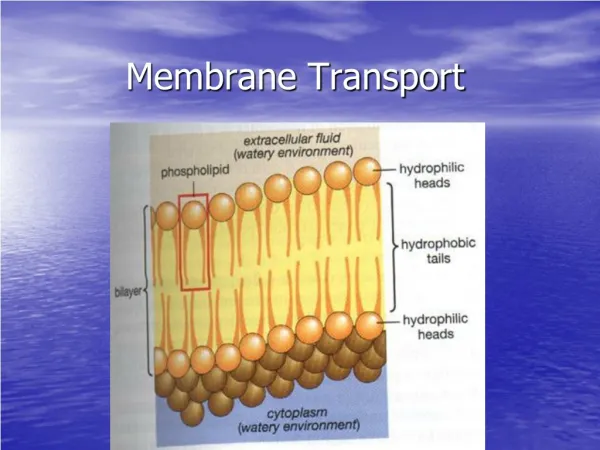
Lecture 14 Membranes continued Diffusion Membrane transport
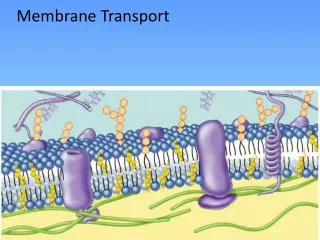
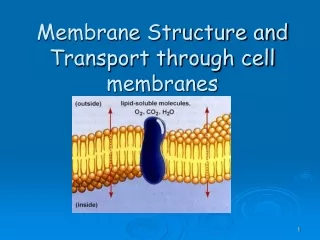
Lipid Bilayers are dynamic distributions of phosphate and carbonyl groups and lateral pressure profiles From S. Feller
Distribution of groups along the z-axis from S. White
Electrostatic potential Dipole Potential Electric Double Layer (EDL)
Lipids at air-water interface s = 70 dyne/cm compressed monolayer surface pressure surface pressure of the crowding surfactant balances part of the surface tension, thus the apparent surface tension to the left of the barrier is smaller
dipalmitoyl phosphatidylcholine (DPPC) monolayer-bilyer equivalence pressure 35-40 dyn/cm Irving Langmuir psurf sw -surface tension of pure water sw- ssurf = psurf ssurf- surface tension in the presence of surfactant psurf – surface pressure of the surfactant psurf
Schematics for measuring surface potentials in lipid monolayers
Differential Scanning Calorimeter (DSC): Phase transition for DPPC (Dipalmitoyl phosphatidylcholine) DS = DH/Tm For DPPC (palmytoyl)…+41°C For DOPC (oleyl)…-18°C http://employees.csbsju.edu/hjakubowski/classes/ch331/lipidstruct/oldynamicves.html
Mixtures of phospholipids Two phases www.mpikg-golm.mpg.de/th/people/jpencer/raftsposter.pdf
Increases short-range order • Broadens phase transition Sizes are wrong?
Phospholipid/ganglioside http://www.nature.com/emboj/journal/v24/n8/full/7600631a.html DOPC/DPPC Lateral Phase Separation Biochim Biophys Acta. 2005 Dec 30;1746(3):172-85. POPC…palmitoyl, oleyl
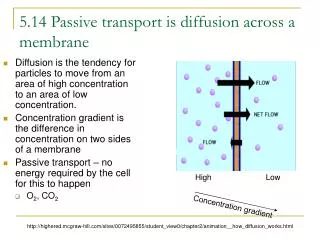
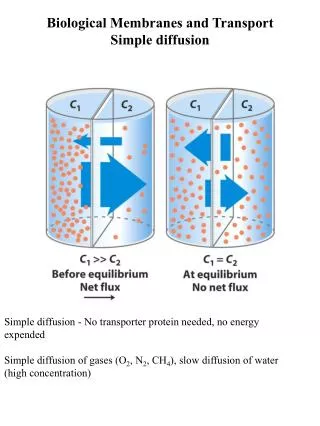
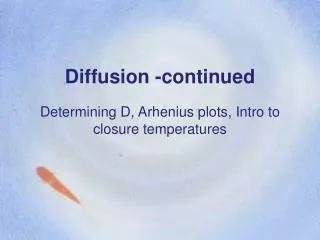
c1 c2 l l Diffusion is a result of random motion which simply maximizes entropy Einstein treatment: negative slope C distance but but therefore: (Fick’s law) (one dimension)
1D 2D z 3D l x y
Diffusion = random walk Fick’s law flux gradient time Diffusion equation rate X, distance
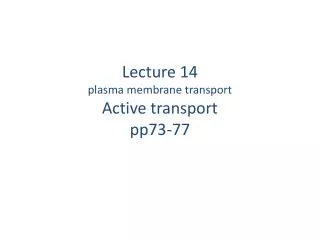
Normal distribution Random walk in one dimension Replace: 100 Variance 80 D= 10-5 cm2/s root-mean-square (standard) deviation t = 1 s p1 ( x ) 60 p2 ( x ) p3 ( x ) 40 where t = 10 s D = diffusion coefficient 20 t = 100 s t = time 0 0.06 0.04 0.02 0 0.02 0.04 0.06 x = deviation from the origin x, cm
1.0 0.5 0 0 1 2 3 4 x, s If we step 1 sigma (s) away from the origin, what do we see? 0.607 concentration area inside 1 s = 0.68 observer
100 60 80 x= 0.0045 cm 50 60 t = 1 s 40 x= 0.014 cm 40 t = 10 s 30 x= 0.045 20 20 t = 100 s 0 10 0 0.005 0.01 0.015 0.02 0.025 0 0 20 40 60 80 100 D= 10-5 cm2/s x = x1, x2, x3 t = t1, t2, t3 t1 = 1 s s= 0.0045 cm t2 = 10 s s= 0.014 cm s= 0.045 cm t3 = 100 s x, cm t, s An observer sees that the concentration first increases and then decreases 1 s is a special point where the concentration of the diffusible substance reaches its maximum
Diffusion across exchange epithelium “random walk” Einstein eqn: <x2> - mean square distance (cm2) D – diffusion coefficient (cm2/s) t – time interval (s)