Download
1 / 32
320 likes | 344 Views
Explore the changing landscape of leadership in rural schools, focusing on economic, demographic, and educational shifts. Discover strategies for optimizing resources and fostering community collaboration in the face of scarcity.

E N D
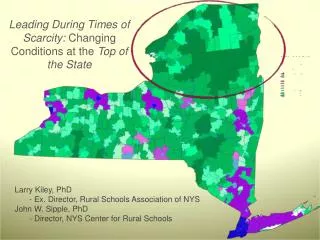
Leading During Times of Scarcity: Changing Conditions at the Top of the State Larry Kiley, PhD - Ex. Director, Rural Schools Association of NYS John W. Sipple, PhD - Director, NYS Center for Rural Schools
Our Goals • To describe the broad context of NYS • To narrow in on the “Top of the State” • To share our thoughts on the current Challenges, Advantages, Opportunities for leadership in your school districts - To share new resources for you.
Small District Summit • March 25th - Syracuse NY • 28 School districts serving fewer than 500 students • Focus on current trends and future pressures • Desire to continue the conversation with larger districts in regional settings.
Major Changes from 1990 to 2000: Fewer Youth 1-9; More Teens, 10-19; Fewer Young Adults 20-34; More Mid-Aged 35-64; Fewer Seniors 65-74; More Elderly 75 & Over
Job Change • 1950 – 40% of upstate workers employed in manufacturing • 2009 – less than 20% - closer to 15% work in manufacturing • 70% of Rural New Yorkers employed in the service industry
Economic Impact(Personal Income) • Increasing levels of poverty – average 11% closing in on national average of 12.4% • Personal Income has grown at ½ the national average – lagged the country by 11% • Workers receive lower wages than counterparts nationwide
School Impact • Number of High Need Rural School Districts grew from 144 in 2004 to 158 in 2009 • More than 36% - Free & Reduced Lunch Count • Having lowest average expenditure per pupil ($12,975) • Lowest mean CWR (.48 or less) • Highest state aid ratio (66.8 or more)
Student Population • Declined at rate of 1% per year since the year 2000 • Rate of decline in High Need Rurals is 1.5% per year since the year 2000
Economic Impact(Property) • Property Values on the Increase – particularly Adirondack Park and Catskill Mountains • In Migration – Metro New York • Relocation • 2nd Homes
Changing Demographics • Expectations and Interest of Long Term Residents • Expectations and Interests of New Residents • Fastest growing Sub population is Hispanic– What does it mean?
Rural Schools • Advantaged? Disadvantaged? • Size • Capacity • Expertise • Expectation • Isolation
Pressures? • Two state commissions • Economy falling off cliff • Declining Enrollments • Weakening property values • Stagnant state-aid • High academic standards
County Population Change1990-2000 Source: Program on Applied Demographics, Cornell University
County Population Projections2000-2030 Source: Program on Applied Demographics, Cornell University
What to do? • Program – Look inside and out • Any ‘Excess’ Capacity • Space, Staff, Healthcare, Pre-K, Technology • Reorganization (consolidation) • Functional Consolidation (sharing) • Inter-municipal Agreements (collaborating)
SBHCs: My Experience • The first and only “reform” that has absolute, uniform buy-in from school personnel who have one. • Collaboration is built on trust and common goals.
Empire State Poll (2009) • If merger resulted in improved academic and after-school activities, how supportive of merger? • 69% NYS, 59% Rural • If merger resulted in reduced property taxes, • 52% support, 29% not support (rural only)
Empire State Poll (2009) How can schools help local community? • Improve preparation for college • 58% NYS, 48% Rural • Improve preparation for local employment • 22% NYS, 25% Rural • Desire no change • 20% NYS, 27% Rural
Empire State Poll (2009) Among these choices, what would best help your local community? If schools provide... • PreK - 27% NYS, 20% Rural • Healthcare - 25% NYS, 27% Rural • Services for immigrant children - 6% NYS, 7% Rural • Services for Parents - 14% NYS, 14% Rural
New York State Center for Rural Schools Three Components • Facilitation - Will act as a clearinghouse and conduit to ensure that the needs of rural schools and communities are heard and met • Capacity - Expertise, Data, and Access to Data • Research - Guided by REAC and the Field
Access to Data & Contact Info • http://pad.human.cornell.edu • http://www.schooldatadirect.org • http://RSANYS.org • http://NYRuralSchools.org • jws28@cornell.edu & lak25@cornell.edu
Questions • What are the implications of what you heard today? For leadership in your schools? Communities? • What can you take away that might help frame how you move forward? • What are your priority areas?