Download
1 / 69
690 likes | 981 Views
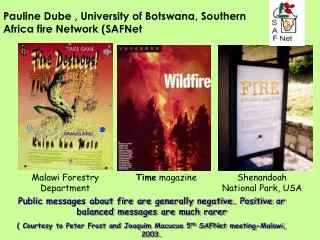
Pauline Dube , University of Botswana, Southern Africa fire Network (SAFNet. Malawi Forestry Department. Time magazine. Shenandoah National Park, USA. Public messages about fire are generally negative. Positive or balanced messages are much rarer

E N D
Pauline Dube , University of Botswana, Southern Africa fire Network (SAFNet Malawi Forestry Department Time magazine Shenandoah National Park, USA Public messages about fire are generally negative. Positive or balanced messages are much rarer ( Courtesy to Peter Frost and Joaquim Macucua 5th SAFNet meeting-Malawi, 2003.
Fire is not always bad 1. Our Ecosystems have evolved with Fire - Fire is part of the savanna landscape • Communities need to use fire to survive – Our Land use systems have evolved with fire. • To continue to be useful it must be controlled i.e. managed
The FOOD, AGRICULTURE AND NATURAL RESOURCES (FANR) DIRECTORATE ( FANR) list Causes of Food Insecurity as: • Insufficient investment in agriculture • Poor access to agricultural inputs and markets • Low technology development and dissemination and • Insufficient preparedness to disasters such as droughts and floods. • ** We need to add FIREto this list!
Satellite Remote Sensing and fire monitoring & management • Large areas of Southern Africa are subjected to frequent wildfires • Fires burn in: • Managed areas - Communal areas & or private farms • Protected areas - National Parks, game reserves • Some of these fires are trans-boundary.
Crop production – clearing fields for cultivation Fire has a long history as a land use tool in Africa • Pastoralism – Controling ticks & regeneration of pasture (Photos by B. Nduna & S. Sento – Okavango delta 2001)
Preparing land for fishing just before the floods arrive e.g. Okavango Delta (Photos by B. Nduna & S. Sento - 2001)
Agricultural use of fire - Senegal Land clearing Slash and burn agriculture: ‘Break’ the forest, more grass, more fires (fragmentation) Better peanut fields = clear lands Crop residues removal - Residues gathered around the trees to accelerate their death. - Fertilisation, multitude little fires just before the rainy season Slide by Cheikh Mbow, 5th SAFNet meeting 2004
Fire Impacts: Destruction of regeneration, grass, hinder flowering, reduce seed bank, disturb soil microbiology, exacerbating erosion and impacts of drought Perennial regrowth in pasture lands How much is lost and how much is gained from regrowth promotion? Slide by C. Mbow- Senegal, 2003
Tanzania - Forest & Beekeeping Dept. – Mini. of National Resources and Tourism identified 10 different sources of fire for the period 1990/91 – 1999/2000: • Preparation of Farms - 36% • Hunting - 27% • Beekeeping - 5.5% • Arson - 14% • Livestock keeping - 5% • Lightening - 4% • Controlled Burning - 3.5% • Masonry - 2% • Cigarette smoking - 1.6% • Others - 1.4% • TOTAL = 100% From UHAI NGO in Tanzania – Prepared for the 4th SAFNet workshop, Kruger National Park – South Africa, 2003
Tanzania: Fire in Plantation Forests: 1990/91 to 1999/2000 • YearFire IncidencesAffected areas Ha • 1990/91 22 1002 • 1991/92 28 964 • 1992/93 17 1934 • 1993/94 19 6735 • 1994/95 12 2614 • 1995/96 23 3042 • 1996/97 45 2076 • 1997/98 17 632 • 1998/99 40 4637 • 1999/00 33 3501 • TOTAL 256 26,237 *Department of Forestry and Beekeeping (FBD), 2001 UHAI NGO, Tanzania – Prepared for the 4th SAFNet workshop, Kruger national Park, South Africa, 2003
Poverty and low technology development results in high reliance on fire for various livelihood activies • Most catastrophic fire events– disasters originate from use of fire in land use activities • But widespread poverty and low technology means that we do not have resources to handle large fire outbreaks and to monitor and manage fire in general
Complex interactions between Socio-economic changes and biophysical processes have resulted in change in fire regimes over the years - for e.g. changes in timing & frequency of fire Some of the land use activities that result in fire outbreaks M.B.M. Sekhwela – AIACC Limpopo Climate Change project- Botswana
A burning fire releases greenhouse gases & aerosols at a regional scale this affects climate
Key Policy Concerns Deforestation; damage to plantations; reduced regeneration; threat to ecosystem functioning and biodiversity Deforestation; loss of grazing; damage to natural resources Deforestation Damage to plantations Loss of wildlife Air pollution Damage to, or destruction of, vegetation (but not considered a priority) Wild fires as threats to human life and property Deforestation Uncontrolled burning, especially in savanna, forest and mountainous areas; air quality (pollution) Damage to woodlands; loss of dry season grazing (Slide: Peter Frost)
Different satellite products are available to assist in fire early warning, fire control and post fire management Satellite fire Management Information fall into these categories: • Fire Danger /Susceptibility/fire risk -Planning Measure to reduce fire risk - Fire Detection - timely location & tracking of a burning fire - Post Fire Assessment-fire damage • Post Fire Recovery • long term impacts and fire history
Information needs for fire danger analysis Meteorological danger indexes- Satellite images- • Land use and population density • - sources of ignition • -Fuel types (biomass loads, density, flammability) • Fuel moisture content) Relative humidity, Air temperature, wind speed & direction Dead fuel moisture content (DeadFMC) Live fuel moisture content (Live FMC) Fire danger Adjusted from:: E. Chuvieco U. Alcala – Spain
Fire behavior and key meteorological factors Fire Intensity kJ/s/m Air Temperature – 0C W. Trollope, 4rd SAFNet workshop, Kruger National Park, South Africa, 2003
Fire is a spatial process that involves land cover - Satellite data has the capability to detect fires Different satellite products are available to assist in fire early warning, fire control and post fire Assessments Courtesy of Philip Frost – South Africa SAFNet Contact Point
Global Geostationary Active Fire Monitoring:Geographical Coverage 80° satellite viewing angle 65° satellite viewing angle Source: Elaine Prins/NOAA
Thermal infrared energy emitted by earth • features is in the range of 3 - 14um.
Chobe National Park Wooster, Smith & Drake (2001) There is need to understand the characteristics of fires on the Ground to be able to effectively use Satellite data to address fire issues
A Cloud Duration image for 1-10 November, 2001-SADC FANR Regional Remote Sensing Unit - An estimate of distribution of rainfall • Rainfall levels are • a strong signal for pasture availability - Fire risks • But also - pests e.g. ticks
March, Dekad 1, 2005 Together with Early warning is the need for Continuous Monitoring NDVI: Normalized Difference Vegetation Index -an estimate of vigor and density of vegetation The time series of NDVI data (from 1982-present)
The vegetation status image is used to show the condition of the biomass with respect to moisture stress. Botswana: Vegetation status data in May 1998 based on NOAA AVHRR NDVI Data T. Ntabeni, 2000
Botswana: Vegetation greeness (moisture) status in August 1998 -Towards the peak fire season T. Ntabeni, 2000
Botswana: Vegetation biomass 1997/8 growing season – based on NOAA AVHRR NDVI data T. Ntabeni, 2000
Proximity to fire ignition sources T. Ntabeni, 2000
Measures to reduce risk of fire outbreaks W. Trollope, 4th SAFNet workshop, Kruger National Park, South Africa, 2003
- Fire Detection - timely location & tracking of a burning fire
Australia, Amhem land: WRS 104-069, 02/09/86.The image size is 185 km by 185 km, or ~34,225 km2.The centre of this scene is 13° 2' South, 133° 29' East Landsat MSS data
300K – typical land surface 600K – typical smoldering 1000K – typical flaming
Detecting active fire: Sensor Saturation • Fires require high sensor saturation levels (>500K) • Traditionally middle infrared bands (3-4 microns) e.g. on NOAA AVHRR data - originally not designed for fire but for ocean & cloud Temp. measurements have been used for fire • AVHRR saturation point is ~ 321-327K - well below the fire temperature: Aproblem for arid & semi-arid environments e.g. Botswana - non burning hot surfaces have been confused with fire =causing false fire Alarms
Nation/region wide fire monitoring Seasonal progression of fires across Angola, Zambia, Zimbabwe, Malawi and Mozambique, April-November 1993, as derived from analysis of fire ‘hot spots’ from NOAA AVHRR imagery (Arino and Melinotte, 1997). Areas and times of extensive burning are clearly identifiable APRIL MAY JUNE JULY AUGUST SEPTEMBER Slide by Peter Frost OCTOBER NOVEMBER
MODIS sensor on board the TERRA - has improved active fire detection and mapping: • has special fire channels: - 4 and 11 micrometer channels brightness temperature - designed to saturate at ~ 500K and 400K, respectively - a spatial resolution of 250m, 500m and 1km
MODIS Fire Detections Quebec, Canada 07/06/02
NASA MODIS Fire Rapid Response Data System Global fire detections and RGB imagery via the Internet using Daily global coverage - 2~4 hour delay http://rapidfire.sci.gsfc.nasa.gov
MODIS Fire Rapid Response Zambia – August 2004 Zimbabwe July 2004 http://rapidfire.sci.gsfc.nasa.gov
Fire Detection - timely location & tracking of a burning fire Moderate Resolution Spectro-radiometer (MODIS) MODIS Monthly Fire detections – October 2001
Active fires 1-3 Sept. 2003 MODIS RRS Philip Frost – CSIR/SAC
1998 ATSR-2 World Fire Atlas (ESA) Source: Arino/ESA
Defense Meteorological Satellite Program (DMSP) – Night time lights
SAFNet members had the opportunity to participated in the validation of the Advanced Fire Information System(AFIS) –(A collaboration among CSIR, UMD and ESKOM Philip Frost: Proceedings of the 5th SAFNet Workshop, Malawi 2004
Assessment of fire damage – burnt scars: • Mostly visual based • and therefore subject to inconsistencies Courtesy – Jomo Mafoko Agricutural Resource Board Botswana
Remote Sensing can provide information Area burnt. Example ASTER image of Chobe National Park - Botswana Figure 4. Chobe National Park - September 2001. On the left is the 1000 m spatial resolution ATSR image covering Chobe National Park, of approximate size 200 x 200 km. A large fire scar is seen as a dark area at upper middle. The right hand image shows the result of a basic burned area mapping technique applied to these data, which has highlighted the burned area in white, though there is also other areas highlighted that are not burned area but some other landcover type. Data from the field campaign will be used to improve these burned area mapping algorithms. A photo of a typical fire scar on the ground is shown in Figure5, indicating why such areas appear dark on the remote sensed images. (Wooster, Smith & Drake, 2001)
Area burnt - Mapping Burnt Scars Fire scars: These can be detected on the bases of 3 main changes on surface properties following a fire: • Vegetation removal • Deposited combustion residue • Temperature differences: At daytime burnt areas will be hotter than vegetated areas – best contrast is at mid-day. Other useful characteristics of fire can be derived from scars: • Fire intensity and fire severity – Degree of vegetation removal can be inferred from date & pattern of burnt area • Homogeneous burn likely to occur in the dry season & indicate high fire intensity • Patchy fires are likely to occur early in the season – indicate lower fire intensity
Mapping Burnt Scars: Visual methods • Fire scars are usually better detected visually e.g on screen manual digitizing • Superior ability of the human mind to detect patterns, texture in addition to spectral information. • Digital methods rely only on spectral differences between burnt & non-burnt areas. • Patchiness of burnt areas make manual digitizing tedious and subjective.
Mapping burnt scars:Computer based methods Methods sensitive to vegetation removal • Most common are Vegetation indices (VIs)= simple algebraic combination of more than one band Basis for use of reflectance based VIs is that VI Values tend to decrease sharply after burning • Such VIs are useful where primary photosynthesis veg. burns e.g. evergreen • In savannas burning occurs over the dry season when veg. is senescence making it less easy to detect scars • Where there is an area where veg. has been removed e.g clearing a field VIs may confuse this with fire scars Deposited combustion residue • Recent scars covered by char combustion residues are usually more darker than unburnt areas especially in NIR band. - This is quickly blown away by wind