Download
1 / 50
500 likes | 614 Views
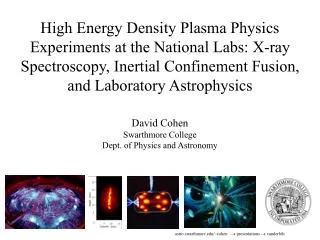
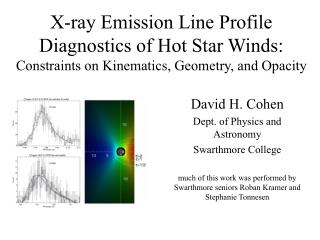
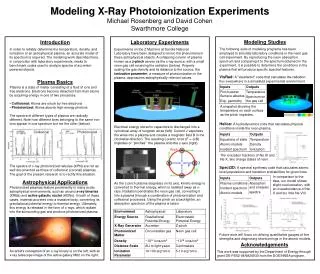
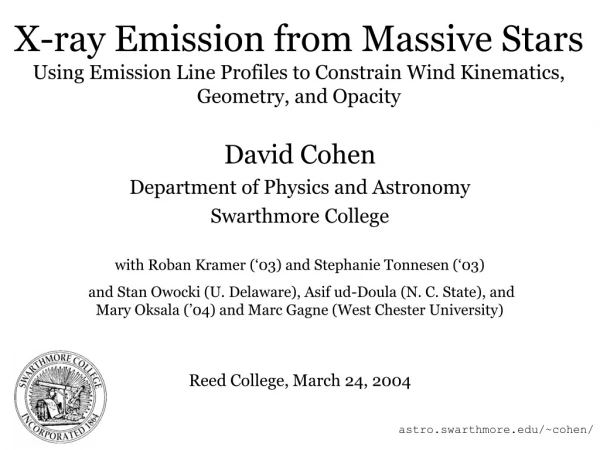
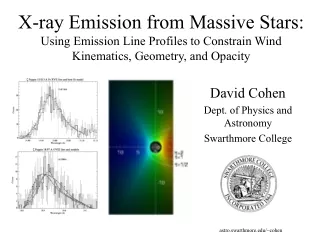
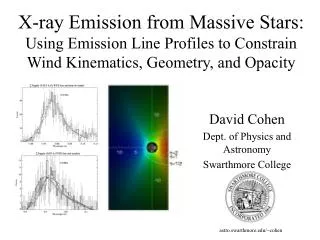
X-ray Emission from Massive Stars: Using Emission Line Profiles to Constrain Wind Kinematics, Geometry, and Opacity. David Cohen Dept. of Physics and Astronomy Swarthmore College. astro.swarthmore.edu/~cohen. Outline. Introduction: the context of hot star X-rays

E N D
X-ray Emission from Massive Stars: Using Emission Line Profiles to Constrain Wind Kinematics, Geometry, and Opacity David Cohen Dept. of Physics and Astronomy Swarthmore College astro.swarthmore.edu/~cohen
Outline • Introduction: the context of hot star X-rays • What do the observations look like? • What trends emerge, and how can the properties of the individual stars and of the trends among lines and among stars be explained by the physical effects we expect might be present? • z Pup: wind x-rays, but less absorption than expected • z Ori and d Ori: similar situation, very little wind absorption; but wind-shock parameters are otherwise satisfactory • Magnetic OB stars are a different story: q1 Ori C, t Sco, g Cas • And so are normal B stars: b Cru, e CMa • Conclusions
Cool stars, like the Sun, have convective envelopes which support a magnetic dynamo, which heats a corona to X-ray emitting temperatures via magnetic reconnection (and other magnetic processes, perhaps)
Stars earlier than about F5 (Teff ~ 8000 K) don’t have convective envelopes and don’t have any X-ray emission… Except that O and early B stars dohave X-ray emission - they are strong sources of soft X-rays. And they have strong stellar winds. HST image of h Car; an extreme example of a hot star wind. Wind broadened and blueshifted UV absorption lines of an O and a B star.
Questions we’d like to address with high-resolution X-ray spectroscopy General: How do OB stars produce X-rays at all? What’s the connection between their massive winds and their X-ray emission? Specific: What’s the nature of wind instabilites and shocks in normal hot stars? Can this (class of) model(s) work? What role do magnetic fields play in hot stars and their X-ray emission? (e.g. do B stars have coronae? How can young hot stars be so hot and bright in X-rays? How can hot stars with extreme X-ray properties be understood?)
Possible connection between hot stars’ radiation-driven winds and their X-ray emission Observed P Cygni profiles in two hot stars: z Pup (O4, 106 Lsun) and t Sco (B0 V, 50,000 Lsun) Steady-state theory is very successful at explaining the time-average properties of hot-star winds
But, hot star winds are not steady-state: They display lots of time variability. 16 days of UV spectra of z Pup. The color plot is the ratio of each spectrum to the mean spectrum (bottom). Cyclical and stochastic variability is seen in most hot stars’ winds
Time dependent models of the winds show lots of structure: turbulence, shock waves, collisions between “clouds” This chaotic behavior is predicted to produce X-rays through shock-heating of some small fraction of the wind. The wind structure - and associated shock heating - is generated by the line-force instability, which relies on Doppler deshadowing of radiatively-driven ions to increase the radiative driving in an exponentially growing feedback process.
A snapshot at a single time from the same simulation. Note the discontinuities in velocity. These are shock fronts, compressing and heating the wind, producing X-rays.
Even in these instability shock models, most of the wind is cold and is a source of X-ray continuum opacity 12 Å 24 Å The massive winds of O stars are expected to be optically thick to soft X-rays…the inner tens of R* may be heavily absorbed: or so it was thought. The wavelength dependence of individual lines leads to the expectation that different absorption characteristics will be seen in different lines from a given star. Neutral (ISM) cross section Wind cross section models
What Line Profiles Can Tell Us • The wavelength of an emitted photon is proportional to the line-of-sight velocity: • Line shape maps emission measure at each velocity/wavelength interval • Continuum absorption by the cold stellar wind affects the line shape • Correlation between line-of-sight velocity and absorption optical depth will cause asymmetries in emission lines X-ray line profiles can provide the most direct observational constraints on the X-ray production mechanism in hot stars
Emission Profiles from a Spherically Symmetric, Expanding Medium A spherically-symmetric, X-ray emitting wind can be built up from a series of concentric shells. Occultation by the star removes red photons, making the profile asymmetric A uniform shell gives a rectangular profile.
Continuum Absorption Acts Like Occultation Red photons are preferentially absorbed, making the line asymmetric: The peak is shifted to the blue, and the red wing becomes much less steep.
We calculate line profiles using a 4-parameter model 3 parameters describe the spatial and velocity distribution of the emission: Ro is the minimum radius of X-ray emission, while bdescribes the acceleration of the wind and q parameterizes the radial dependence of the filling factor. 1 parameter, t* describes the level of continuum absorption in the overlying wind. A wind terminal velocity is assumed based on UV observations, and the calculated line profile is convolved with the appropriate instrument-response function for each line.
In addition to the wind-shock model, our empirical line profile model can also describe a corona With most of the emission concentrated near the photosphere and with very little acceleration, the resulting line profiles are very narrow.
t=1,2,8 A wide variety of wind-shock properties can be modeled Ro=1.5 Line profiles change in characteristic ways with t* and Ro, becoming broader and more skewed with increasing t* and broader and more flat-topped with increasing Ro. Ro=3 Ro=10
The Chandra Archive of Hot Stars Because of the pathetically small effective area of the gratings, only a handful of single OB stars can produce high-quality spectra – maybe a dozen total; we will look at several representative single OB stars
Chandra (and XMM) have increased the spectral resolution avalable to X-ray astronomers by almost a factor of 100. Diagnostics and Physical Properties We’re talking about thermal, collisional/coronal, equilibrium, optically thin plasmas here…probably Temperatures and overall emission levels: DEMs Densities: line ratios…but also source location via f/i Abundances: line ratios and line-to-continuum ratios Local absorption: globally and within individual lines Signatures of photoionization: fluorescence Kinematics: line broadening and profile shapes
Global appearance of spectra (Chandra MEG) q1 Ori C (O7 V) • Pup (O4 I) • Ori (O9.5 II) • Sco (B0 V) • Cru (B0.5 IV) • Ori (O9.7 I) 10 Å 20 Å 10 Å 20 Å
Focus in on a characteristic portion of the spectrum 15Å 12Å 12Å 15Å q1 Ori C (O7 V) • Pup (O4 I) • Sco (B0 V) • Ori (O9.5 II) dOri (O9.7 I) • Cru (B0.5 IV) Ne X Ne X Ne IX Fe XVII Ne IX Fe XVII There is clearly a range of line profile morphologies from star to star
Differences in the line shapes become apparent when we look at a single line (here Ne X, Lya) q1 Ori C zPup gCas tSco zOri AB Dor (K1 Vp) dOri bCru Capella (G2 III)
Our idea: fit lines with the simplest model that can do the job, and use one that, while based in physics, is general in the sense that any number of physical models can be tested or constrained based on the model fits. From Owocki & Cohen (2001): spherically symmetric, two-fluid (hot plasma is interspersed in the cold, x-ray absorbing bulk wind); beta velocity law. Visualizations of the wind use hue to indicate line-of-sight velocity and saturation to indicate emissivity; corresponding profiles are plotted vs. scaled velocity where x = -1,1 correspond to the terminal velocity.
The model has four parameters: Ro=1.5 for r>Ro Ro=3 where The line profile is calculated from: Ro=10 Increasing Ro makes lines broader; increasing t* makes them more blueshifted and skewed. t=1,2,4
We fit all the (8) unblended strong lines in the Chandra spectrum of z Pup: all the fits are statistically good Ne X 12.13 Å Fe XVII 15.01 Å Fe XVII 16.78 Å N VII 24.78 Å Fe XVII 17.05 Å O VIII 18.97 Å
We place uncertainties on the derived model parameters lowest t* best t* highest t* Here we show the best-fit model to the O VIII line and two models that are marginally (at the 95% limit) consistent with the data; they are the models with the highest and lowestt* values possible.
Graphical depiction of the best fit (black circles) and 95% confidence limits (gray triangles) on the three fitted parameters for seven of the lines in the z Pup spectrum. q Ro t*
Lines are well fit by our four parameter model (b is actually held constant at b=1; so three free parameters): z Pup’s X-ray lines are consistent with a spatially distributed, spherically symmetric, radially accelerating wind scenario, with reasonable parameters: • t*~1 :4 to 15 times less than predicted • Ro~1.5 • q~0 • But, the level of wind absorption is significantly below what’s expected. • And, there’s no significant wavelength dependence of the optical depth (or any parameters).
Ro of several tenths of a stellar radius is expected based on numerical simulations of the line-force instability (self-excited on the left; sound wave purturbations at the base of the wind on the right) Location of the X-ray-emitting plasma near the photosphere is indicated by He-like f/i ratios (Kahn et al. 2001)
Wind opacity for canonical B star abundances. We do expect some wavelength dependence of the cross sections (and thus of the wind optical depth), BUT the lines we fit cover only a modest range of wavelengths. And in the case of z Pup, nitrogen overabundance (not in calculation shown at right) could flatten out the wavelength dependence even more. OR perhaps clumping plays a role. And clumping (alt. “porosity”) certainly could play a role in the overall reduction of wind optical depth. N K-edge Note: dotted line is interstellar.
Do the other O supergiants, z Ori and d Ori, fit into the wind-shock paradigm? The strong lines in these other O supergiants can also be fit by the simple spherically symmetric wind model z Ori O VIII 18.97 Å d Ori Fe XVII 15.01 Å t*=0 t*=0.4 Though they are clearly less asymmetric and a little narrower
Best-fit t* values are a few tenths, although a value of zero can be ruled out at the 95% confidence limit in all but one line…however, values above 0.5 or even 1 cannot be ruled out in most cases dOri zOri
Ro, the radius of the onset of X-ray emission is within the first stellar radius above the photosphere; and consistent with a height of 3/10 R* or less at the 95% confidence level for all the lines dOri zOri It’s these small Ro values that produce the relative narrowness of the lines (compared to z Pup).
Conclusions for normal, O supergiants Spherically symmetric, standard wind-shock model fits the data But the level of continuum absorption in the wind must be reduced from expected values by factors of ~5 (clumping?) Other diagnostics (DEM, abundances, density-sensitive line ratios) provide information too; generally consistent with the standard picture.
What about the stars with the harder X-rays and narrower lines: q1 Ori C and t Sco? t Sco’s Ne X line overplotted with a delta function model. Capella t Sco z Pup The lines in t Sco look more like those in coronal sources…and the lines in q1 Ori C aren’t a whole lot broader.
Ne X lines of representative stars again z Pup The O7 V star, q1 Ori C has a strong wind, like the O4 supergiant z Pup, but it is very young and has a strong magnetic field. The B0 V star, t Sco is also young (but not as young). q1 Ori C t Sco
The large x-ray luminosities and hard x-ray spectra (of q1 Ori C and t Sco) already argue against instability-generated shocks… …and suggest that a hybrid wind-magnetic model might be appropriate, especially on q1 Ori C, on which an 1100 G dipole field has been discovered ud-Doula and Owocki (2001) have performed MHD simulations of magnetically channelled winds: Equatorward flow inside closed field lines and associated strong shocks are seen. y-component of velocity
The Magnetically Confined Wind Shock model (Babel and Montmerle 1997) has been applied to stars with large-scale, strong dipole fields and winds, like Ap/Bp stars
ud-Doula has made models specific to q1 Ori C, and included radiative cooling for the first time: This is a movie of density, evolving from an initial spherically symmetric steady-state wind. density movie
log Temperature temperature movie
speed speed movie
Speed (again), but with low speeds emphasized (low) speed movie
We looked at some snapshots from these simulations and synthesized line profiles (and emission measure distributions and light curves) This first snapshot of q1 Ori C is from a time when the hot plasma is relatively placid, filling the closed loop region speed density temperature Note: throughout, the speed is in terms of an assumed terminal speed of 2500 km s-1
The geometry and viewing angle are relatively well established for this star. There is a 45tilt between the rotation axis and both the magnetic axis and the direction of the Earth: we see a full range of viewing angles of the magnetosphere, and have Chandra observations for four of them.
We thus synthesize line profiles for a range of viewing angles Here we show 0, looking down the magnetic axis Color contours are now line-of-sight velocity; and the black contours enclose plasma with T > 106 K
Overall X-ray flux synthesized from the same MHD simulation snapshot. The dip at oblique viewing angles is due to stellar occultation. Data from four different Chandra observations is superimposed.
Summary of magnetically channeled wind shock model applied to q1 Ori C The X-ray emission lines of q1 Ori C are quite narrow at all observed viewing angles -- as our MHD simulations predict. And occultation of the magnetosphere by the star accounts nicely for the modest change in X-ray flux with viewing angle. Finally, He-like forbidden-to-intercombination line ratios in Mg and S indicate that the bulk of the X-ray emitting plasma is within 1 stellar radius of the photosphere - in accord with the MHD simulations.
The Ne X line once again t Sco b Cru is a normal, early B star - neither magnetic nor young; it has a wind, but its profiles are also narrow. b Cru (B0.5 III)
Magnetic OB stars, and normal B stars Magnetically channeled wind-shock models are promising (q1 Ori C, perhaps t Sco): Schulz (2003) has shown that O stars have these X-ray signatures for less than 1 million years on the main sequence Normal B stars (like b Cru, B0.5 IV and e CMa B2 II) have very soft X-ray spectra and narrow lines: wind shocks if the X-ray wind isn’t moving very fast? Magnetically channeled wind shocks if the shocks aren’t very strong? Dynamo-driven coronae if our understanding of dynamos is incomplete…
Conclusions • There is a relatively wide variety of line profile morphologies seen in Chandra and XMM observations of OB stars, indicating that a surprising variety of high-energy physical processes are occurring in early-type stars • Supergiants with massive radiation-driven winds have X-ray emitting plasma distributed throughout their winds: Standard wind-shock models explain the data if the mean optical depth of the cool wind component is several times lower than expected (mass-loss rates overestimated? clumping?) • Young O and early B stars are well explained by the hybrid magnetically channeled wind shock model • Normal B stars don’t fit neatly into any of these paradigms