Download
1 / 16
160 likes | 292 Views
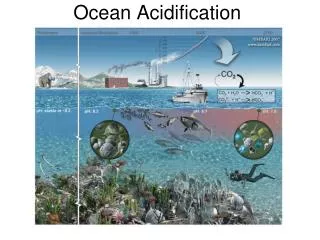
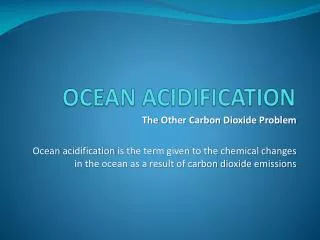
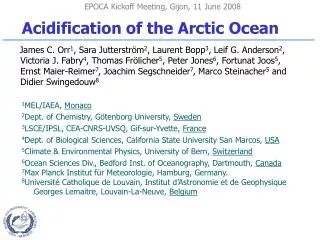
Transcriptomic responses of Emiliania huxleyi to Ocean Acidification. Sebastian D. Rokitta , Uwe John and Björn Rost. Ocean Acidifcation. 35. 30. 25. 20. 15. 10. 5. 0. [CO 2 ]. pH SWS. [DIC]. [µmol kg -1 ]. [CO 3 2- ]. 8.2. 2400. [µmol kg -1 ]. pH. 2000. 300. 8.1. DIC.

E N D
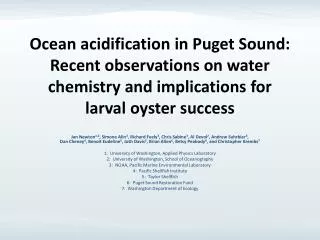
Transcriptomic responsesof Emiliania huxleyito Ocean Acidification Sebastian D. Rokitta, Uwe John and Björn Rost
OceanAcidifcation 35 30 25 20 15 10 5 0 [CO2] pHSWS [DIC] [µmol kg-1] [CO32-] 8.2 2400 [µmol kg-1] pH 2000 300 8.1 DIC 1600 250 1200 8.0 200 CO32- 800 150 7.9 400 100 0 7.8 CO2 50 0 1850 1900 1950 2000 2050 2100 Year After Wolf-Gladrow et al. (1999)
Coccolithophores • Photo: NASA, PML
OA-responses in E. huxleyi Modifiedfrom Hoppe et al. (2011)
The matrixapproach • Light vs. pCO2 • 380 µatm 1000 µatm • Acclimationdata (µ, POC, PIC) • Physiology (Ciacquisition, lightreactions) • Transcriptomics (geneexpression) • 50 µmolphotons m-2 s-1 • 300 µmolphotons m-2 s-1
PhenomenologyRokitta & Rost (2012) • PIC productiondrops (especiallyunderlowlight!) • POC productionisboosted (especiallyunderlowlight!) • TPC productionisinsensitive
PhysiologyRokitta & Rost (2012) • More POC despitelesspigmentationand O2evolution Improvedenergyefficiencyunder OA
Transcriptomics OA responsive genes 1172 ↑ Low-light acclimation 861 ↓ 1082↑ High-light acclimation 814 ↓
Transcriptomics Low-light specific 447 ↑ 725 ↑ 236 ↓ 625 ↓ Core OA-response High-light specific 357 ↑ 189 ↓
Transcriptomics Core OA-response LL specific OA-response HL specific OA-response Carbonmetabolism Light physiology Signalling Ion fluxes # of genes; signdenotesregulation(+ ↑; - ↓) • Pentosephosphatepathway ↑ • Glycolysis ↓ • Regulation of C fluxes ↑ Organellar shuttling↑ -40 -40 -40 -20 -20 -20 0 0 0 20 20 20 40 40 40 • FattyAcid & Glucan anabolism↑ • Energydissipation↑ • Energydissipation↑ • Lipid and IP3signaling↑ • Membrane potentials↑
OA re-wirescarbonfluxes NADPH NADH
OA affectsthe redox hub NADP/NADPH NAD/NADH GSH Mitochon-drium Ca2+ ROS Asc Carbonmetabolism Chloro-plast Trx ROS XC EMS ... ROS Ca2+
Conclusions • OA causes a shuntingofcarbonfrom calcification towardsbiomassproduction • OA-Responses aremodulatedbyenergyavailabilityandtypicallyattenuatedbyhighlight • OA affectscellularsignalingandtheredox hub andtherebyre-wirescarbonfluxnetworks