Ocean Acidification
Ocean Acidification. What Is It ? For UFA Juneau Feb 2010 Gary Freitag Marine Advisory Program Ketchikan Alaska Sea Grant Univ of AK Fairbanks Jeremy Mathis UAF. First A Couple Definitions. pH :

Ocean Acidification
E N D
Presentation Transcript
OceanAcidification What Is It ? For UFA Juneau Feb 2010 Gary Freitag Marine Advisory Program Ketchikan Alaska Sea Grant Univ of AK Fairbanks Jeremy Mathis UAF
First A Couple Definitions pH : this is a water measurement on a logarithmic scale that will tell you water is considered acidic, neutral or alkaline. A pH of 7 is considered "neutral", under 7 is considered "acidic" and over 7 is considered "alkaline". Average Ocean water ranges between 7.90 to 8.20. Alkaline : alkaline relates to the pH scale where a measurement of the water is over 7 and is considered "basic or alkaline". Alkalinity : Alkalinity is basically a measurement of how well the water can buffer against a drop in pH or the capacity of water for neutralizing an acid solution. An alkalinity test will measure the levels of elements such as carbonates, bicarbonates and some other elements. It is usually measured in units of meq/L or ppm which are essentially the same.
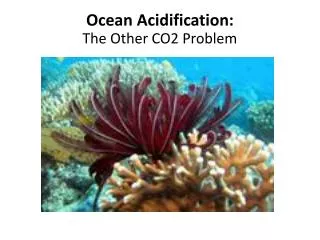
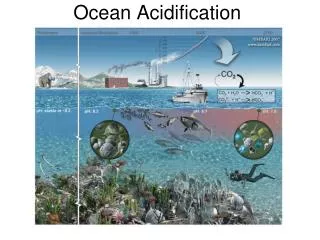
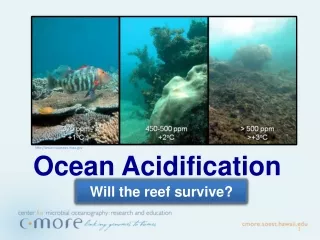
The CO2 Problem “It is very likely that [man-made] greenhouse gas increases caused most of the average temperature increase since the mid-20 century” - IPPC 4th Assessment Report The ocean has taken up 1/3 to 1/2 of all anthropogenic CO2 emissions. However, since the ocean mixes slowly it is concentrated in the upper 10%. Sabine et al. Science (2004)
Creating A More Acidic Ocean Adapted from the International Observational Network for Ocean Acidification document
What is Ocean Acidification? • As more CO2 dissolves into the ocean, more H+ ions are given off. • As the concentrations of H+ ions increase, the pH of the water decreases.
Creating A More Acidic Ocean Under the “Business-As-Usual” scenario, ocean acidity will likely increase rapidly over the next 25 years.
Ocean Acidification Changes in ocean pH since the Industrial Revolution From GLODAP Dataset
Carbonate Mineral Saturation Depth Depth at which calcite and aragonite become undersaturated and potentially corrosive to shell building organisms The closer to the surface the saturation depth, the more likely organisms will be exposed to undersaturated waters Feely et al. (2004)
What We Don’t Know • How pH, alkalinity, aragonite and calcite saturation level varies on smaller temporal and spatial scales in the ocean of Alaska. (need for more samples) • How lower pH will directly impact salmon-(ie metabolism, skeleton structure) • If pteropods decline will another salmon food organism (ie amphipods) take advantage of the decline of competition for food (zooplankton) • What are the long term effects from lower pH and buffering capacity of the ocean • Effects to the current trophic level structure • What will benefit with a lower pH ocean
Samples of Opportunity Program • Infrastructure is being developed at UAF that will allow commercial fisherman and NGOs to collect pH samples in Alaska coastal waters. These samples will be send to Dr. Mathis’ Chemical Oceanography lab for analysis.
Sampling • A protocol will be developed (procedures and data sheets) • Pre washed and treated sample bottles will be delivered to those participating • Chemicals will be added to prevent changes to the water properties • Surface samples will be taken according to the protocol procedures • They will shipped to Dr Mathis for Analysis.
NPRB Gulf of Alaska IntegratedEcosystem Research Program (GOA IERP) The Gulf of Alaska (GOA) is one of the world’s most productive ocean regions. It sustains large animal populations and provides a way of life for many people. The Alaska Current and the Alaska Coastal Current dominate the GOA. These are the strongest and most persistent currents found along either coast of North America. They function as pathways for organisms and the resources they depend on. The large embayment estuaries of the southeast island archipelago, Prince William Sound, Kenai Fjords, Cook Inlet, and Shelikof Strait provide nursery and juvenile habitat for many species. The value of an integrated ecosystem research program is that it brings together different disciplines to comprehensively attempt to answer complex ecological questions in the face of uncertainty and ecosystem change.
A four-Component program • Upper Trophic Level (UTL):The overall goal of this component focuses on identifying and quantifying the major ecosystem processes that regulate recruitment strength of key species in the GOA • Forage Base: To focus on forage base and resources which influence the productivity of the top level predator(s) chosen. The type, quality and quantity of food, and its timing and location, are critical to understanding higher trophic level responses. • Lower Trophic Level and Physical Oceanography: To focus on biological and physical oceanographic parameters on which this portion of the ecosystem is based. This includes euphausiids, fish eggs, and larval fishes. • Ecosystem Modeling: To describe and predict the responses (and variability therein) of this portion of the GOA ecosystem to environmental and anthropogenic processes, including climate change.
Timeline • The GOA IERP will include one planning year (FY2010), three field years (FY 2011, 2012 and 2013), followed by one synthesis year (2014).