Download
1 / 21
210 likes | 341 Views
Support Vector Machines (SVM) are powerful algorithms for classification, numeric prediction, and pattern recognition. They effectively define hyperplanes that separate different classes within multidimensional feature spaces, balancing the need for accuracy and margin. In application, SVMs excel in bioinformatics for gene expression classification, text categorization, and detecting significant events. By leveraging techniques like quadratic optimization and kernel tricks, SVMs can handle both linearly and non-linearly separable data while addressing challenges in image recognition, ensuring effective learning in noisy environments.

E N D
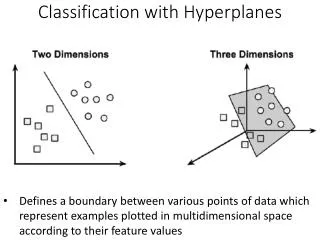
Classification with Hyperplanes • Defines a boundary between various points of data which represent examples plotted in multidimensional space according to their feature values
SVM Applications • Classification • Numeric Prediction • Pattern Recognition • Classification of microarray gene expression data in the field of bioinformatics to identify cancer or other genetic diseases • Text categorization, such as identification of the language used in a document or organizing documents by subject matter • The detection of rare yet important events like combustion engine failure, security breaches, or earthquakes
How does the algorithm choose? Identify a line that separates the two classes. • There is more than one choice of dividing line between the groups of circles and squares • Three such possibilities are labeled a, b, and c.
Finding the Maximum Margin Hyperplane • The support vectors are the points from each class that are the closest to the MMH; each class must have at least one support vector, but it is possible to have more than one.
The Case of Linearly Separable Data • the MMH is as far away as possible from the outer boundaries of the two groups of data points. • These outer boundaries are known as the convex hull. The MMH is then the perpendicularbisectorof the shortest line between the two convex hulls. • Sophisticated computer algorithms that use a technique known as quadratic optimization are capable of finding the maximum margin in this way.
The Case of Non-Linearly Separable Data What happens in the case that the data are not linearly separable? Use of a slack variable, which creates a soft margin that allows some points to fall on the incorrect side of the margin
Using Kernels for Non-Linear Spaces Kernel trick involves adding new features that express mathematical relationships between measured characteristics.
Image Pattern Recognition Challenges • Image processing is a difficult task • The relationships linking patterns of pixels to higher concepts are extremely complex and hard to define. • For instance, it's easy for a human being to recognize the letter A, but defining these patterns in strict rules is difficult. Image data is often noisy. There can be many slight variations in how the image was captured depending on the lighting, orientation, and positioning of the subject.
SVMs and Image Processing • SVMs are well-suited to tackle image data • Capable of learning complex patterns without being overly sensitive to noise • Recognize visual patterns with a high degree of accuracy. • The key weakness of SVMs—the black box model representation—is less critical for image processing. If an SVM can differentiate a cat from a dog, it does not much matter how it is doing so.
The dataset contains 20,000 examples of 26 English alphabet capital letters as printed using 20 different randomly reshaped and distorted black and white fonts.
Exploring and Preparing the Data • When the glyphs are scanned into the computer, they are converted into pixels and 16 statistical attributes are recorded. Explore Data Set Sort by Letter
OCR Data • When OCR software first processes a document, it divides the paper into a matrix such that each cell in the grid contains a single glyph, which is just a fancy way of referring to a letter, symbol, or number. • Next, for each cell, the software will attempt to match the glyph to a set of all characters it recognizes.