Download
1 / 23
310 likes | 779 Views
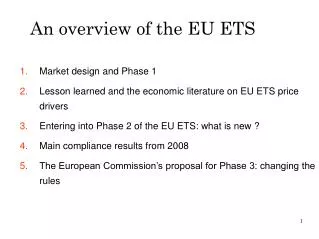
An overview of the EU ETS. Market design and Phase 1 Lesson learned and the economic literature on EU ETS price drivers Entering into Phase 2 of the EU ETS: what is new ? Main compliance results from 2008 The European Commission’s proposal for Phase 3: changing the rules.

E N D
An overview of the EU ETS • Market design and Phase 1 • Lesson learned and the economic literature on EU ETS price drivers • Entering into Phase 2 of the EU ETS: what is new ? • Main compliance results from 2008 • The European Commission’s proposal for Phase 3: changing the rules
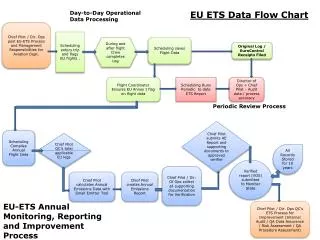
EU ETS installations’ timeline Beginning of Year N of the EU ETS End ofYear N of the EU ETS Publication of Year N-1 emissions by the EC Double-allocation period 15 May 30 Apr. 31 Dec. 1st Jan. 28 Feb. 30 Mar. Year Nallocation on installations’ accounts in their national registry Installations surrender the allowances covering their Year N-1 emissions in the national registry Installations submit their verified emissions forYear N-1 to the national authority
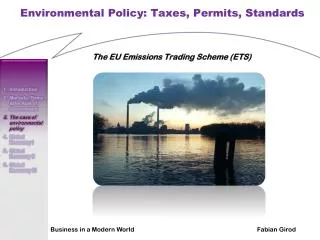
The EU ETS: A tool to cap EU CO2 emissions • EU ETS Directive in 2003 when no KP ratification • 2 compliance periods (now 3) • 25 then 27 MS with different economic and social backgrounds • Referee: the European Commission European 3x20 Objectives Dec: End ofEU ETS phase II 1 Jan: Beginning ofEU ETS phase II 1 Jan: Beginning of EU ETS phase I 2012 2013 2007 2020 2005 2008 Dec: End of first Kyoto Protocol period 1 Jan: Beginning of first Kyoto Protocol period Feb: Kyoto Protocol comes into force
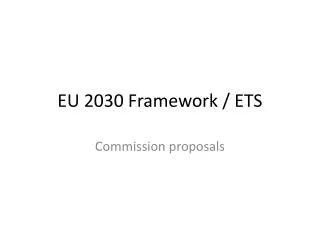
A successful start for the market in Phase 1… • Installations may be « short » or « long » Phase I Allocations minus Emissions (Mt CO2) • Can buy or sell allowances on a financial market • Trades through exchanges or Over-The-Counter agreements • Compliance and financial markets Minimum exchanges on the market: 650 Mt « Long » Installations « Short » Installations Source: Mission Climat from CITL.
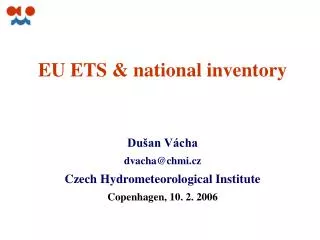
… with the emergence of a reliable carbon price • Sharp growth in traded volumes: 262 Mt (2005) 1,454 Mt (2009 Q1 + Q2) 3,505 Mt • EUA December 2009: €13.10 / EUA December 2012: €14.66 Source: ECX, BlueNext, Reuters
Lessons learned from Phase I • Convery (2009) • Convery, Ellerman, de Perthuis (2009) • Ellermann and Joskow (2008) • The pilot phase was useful, despite the shortcomings (such as the structural break in 2006 after the emission verification; vintage effect due to banking restrictions). • Carbon now has a (real) price. • Carbon price has induced “some” emissions abatement, in the form ofintra-fuel substitution (brown to hard coal) in Germany and improved CO2 efficiency in the UK. • Carbon price has had a limited impact on industrial competitiveness. • The European carbon market has had external impacts linking different carbon markets.
Price drivers in the CO2 market: where do we stand? • Theoretical contributions: • institutional factors: tightness of national targets, market liquidity, link with Kyoto flexible mechanisms, banking-borrowing; uncertainties about future regulations. • market structure; macroeconomic factors: GDP level and economic growth; microeconomic factors: fuel prices, energy substitutability possibilities and the costs of abatement efforts/technologies, sectors' characteristics. • exogenous factors: climate variables. • Empirical contributions: • market structure, climate, institutions (Alberola et al. 2008, Mansanet et al 2007, among others); • volatility models - financial approach (Daskalakis et al. 2007, Paolella et al. 2007, Seifert et al. 2008).
EU ETS Phase II: extension of the coverage and reduction in allocations • Phase 2 encompasses: • The inclusion of new sectors and gases: • opt-in for N2O in France and the Netherlands • inclusion of the aviation sector in 2011 • The inclusion of new countries: Norway (+ Iceland and Liechtenstein) • The reduction in allocations (-10%) Additional demand for EUAs • The emissions covered by the EU ETS represent: • 41% of European greenhouse gas emissions… • 11% of emissions from developed nations … • 4% of the world’s total GHG emissions.
EU ETS phase 2 : allocations Phase II Distribution of the 1,958 Mt of annual allowances Source: Mission Climat from CITL.
The EU-ETS in 2006: the “most representative” year for Phase I
Comparison: 2006 versus 2008 23,40 14,36 30,53 3,46
EU ETS Phase II: the use of Kyoto projects for EU ETS compliance • Emissions reductions outside the EU ETS • Possible import of Kyoto credits limited to 1,400 Mt over 2008-2012 (or 2008-2020?) Supply of CER credits before April 2013 Source: Mission Climat de la Caisse des Dépôts, August 2009
JI : Potential growth of Joint Implementation in Europe • JI projects are also hosted by European countries • Eastern Europe: 287 million JI credits expected until 2012 • EU15: France, Germany, Spain, and Denmark have also developed procedures for hosting JI projects (+New Zealand) • Russia and Ukraine have hosted the majority of JI projects to date: • Russia: 211 million JI credits expected until 2012 • Ukraine: 25,9 million JI credits expected until 2012 • Bulgaria : 5,5 million JI credits Annual ERU from JI projects Source: UNEP/RISOE JI Pipeline, september, 2009
Compliance 2008 by countries • 14 countries are short: Germany about 43,8 Mt; UK about 43,1 Mt • 14 countries are long : Slovakia with 6,7 Mt Source: CITL, Mission Climat of Caisse des Dépôts
Compliance 2008 by sector • Two sectors are short: combustion sector about 204 MtC02 and refineries about 1,8 MtC02 Source: CITL, Mission Climat of Caisse des Dépôts
EUA and CER surrendered for 2008 compliance CER – ERU use for 2008 compliance • Share of countries in which CER surrendered for 2008 compliance Source: CITL, Mission Climat of Caisse des Dépôts
EU ETS Phase II: compliance results • Phase II 2008 – 2012: a short period with – 439 Mt Source: CITL, Mission Climat of Caisse des Dépôts
Phase III: Reducing the allocation: an incentive for emission reduction • Energy climate package defines phase III rules: - 20% versus -30%? • Phase III features: • Extension of the market until 2020 • Decreasing the allocation cap • Towards a full auctioning? Source: Mission Climat of Caisse des Dépôts
Which impact on the industry competitiveness? • No observed impact on market shares during Phase I… • But potential impact on the long term for energy intensive industries • All industries but power production at different levels • Indirect impact for electricity-intensive industries • Impacts of new features of the EU ETS to be assessed by the EC before December 2010 • Solutions? Free allocation, border tax adjustments, sectoral agreements…
The EU ETS in the world • Possible links with other cap-and-trade programs: • Complete fungibility between ETS seems difficult, but the common use of projects mechanisms could be a first step. • First linking opportunities: RGGI, Australia, New Zealand • Looking toward the future: a US federal trading program? • How to get ready: • Voluntary agreements • Sectoral agreements • The next steps: • After Copenhagen, waiting for Mexico City…