Visual Perception Process: Key Factors in Contrast Sensitivity Analysis
Explore how the visual perception process depends on the visual limitations of observers and their mental processes, as affected by cone and rod receptors, sensitivity to contrast, and characteristics of the human retina. Discover the Contrast Sensitivity of the Eye and its application in optical imaging for detection, recognition, and identification of objects. Learn about the Rose model, Receiver Operating Characteristic analysis, and the impact of spatial frequency on contrast detail analysis.

Visual Perception Process: Key Factors in Contrast Sensitivity Analysis
E N D
Presentation Transcript
Visual Perception Process Depend on visual limitation of observer & their mental process Low radiation exposure low S/N Low response of eye & brain
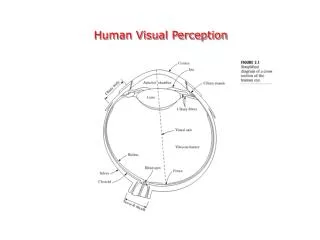
Cone receptors rod receptors 6-7 millions 75-150 millions Centered in fovea over the retina Sensitive color & light sensitive to low light Each connected to 1 nerve several connected to 1 nerve Resolve fine details show overall picture of field Sensitivity & Contrast Characteristic of vision Are related to structure of human retina:
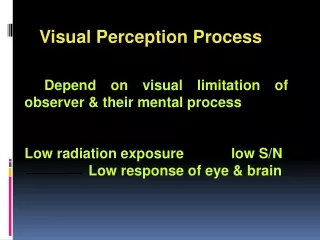
Contrast Sensitivity of Eye 1357 9 11 فركانس (Cycles/degree) Typical contrast sensitivity of eye for a sine-wave gratings for two luminance levels
Contrast Sensitivity of Eye Remarkable facts from the curve: 1) Human eye-brain is adapted for the perception of sharp boundaries at peaks 2) There is a limit to the degree of fine detail that can be perceived 3) Very gradual boundaries (diffusely infiltrating border of a tumor maybe missed unless be enhanced by processing. 4) Optimum illumination should be set: For particular resolution of object For optimum perception of image details For suppression of noise & artifact
B+ ΔB Object B Background Contrast resolution • The ability to discriminate regions of different image brightness. • Under ideal condition (bright illuminate, sharp boundary, size, low nose) eye is capable of contrast resolution of 1%. Weber ratio (threshold contrast resolution)ΔB/B
حساسيت چشم به کنتراست در شرايط کنتراست ثابت
ThresholdContrast resolution Weber Ratio Depends on the size of object (eg. observed circular disc object.
Detection of an Object • Three stage of perception in optical imaging: • Detection (whether some abnormality is present) • 2)Recognition (features, e.g: size & shape is quantified) • 3)Identification (which disease pattern correspond to)
Object Detection is Size dependent The size of object is detectable if it is equal or bigger than 1/n (n is the highest detectable spatial frequency; Cy/degree) Object size for Recognition and Identification should be 4 and 6.5 times of detection, respectively.
Contrast resolution Depends on Spatial - frequency (details of object): Effect of spatial resolution is investigated by: measuring the degree of modulation that is necessary for visual detectability as function of spatial frequency (in various noise conditions) This is called: Noise Related Modulation or NRM Demand Modulation FunctionDMF
MTF مورد نياز تشخيصDemand Modulation Function (Noise required modulation) فركا نسCycle/degree
Contrast-detail analysis Rose model is measure of contrast-detail analysis. Rose model provides a simple mathematical equation for the relationship between SNR (k), object size (A), and contrast (C): k2 = C2 N = C2 ΦA Where: k = SNR needed to just see an object in an image C = contrast of the object with respect to surrounding background N = number of photons used to image the object of area A A = area of the object Φ = photon fluence (N/A) used to form the image
With a fixed value of k (SNR=5-7) we can estimate the size of the smallest object (A) we might be able to see at contrast level (C) with photon fluence (Φ) using Rose model. Smaller objects must have higher contrast to be seen in the image. The Rose model is a key element in estimation of the observability of low contrast objects in a noisy image (conditions often found in radiology).
"contrast detail" curve in which the size (i.e. detail) of smallest observable objects are plotted against their contrast for a given noise level.
Receiver operating characteristic (ROC) analysis Which is the performance of the observer, with the aim of evaluating an imaging system.
YES NO YES NO TP FP FN TN وجود ضايعه واقعي قضاوت تشخيص دهنده