Download
1 / 13
140 likes | 286 Views
Multiple-Cone Formation during the Femtosecond-Laser Pulse Propagation in Silica. Kenichi Ishikawa * , Hiroshi Kumagai, and Katsumi Midorikawa Laser Technology Laboratory, RIKEN, Hirosawa 2-1, Wako-shi, Saitama 351-0198, Japan

E N D
Multiple-Cone Formation during the Femtosecond-Laser Pulse Propagation in Silica Kenichi Ishikawa*, Hiroshi Kumagai, and Katsumi Midorikawa Laser Technology Laboratory, RIKEN, Hirosawa 2-1, Wako-shi, Saitama 351-0198, Japan *Present address : Department of Quantum Engineering & Systems Science, Graduate School of Engineering, University of Tokyo 7-3-1 Hongo, Bunkyo-ku, Tokyo 113-8656, Japan Email:ishiken@q.t.u-tokyo.ac.jp submitted to Phys. Rev. E
Abstract We present a numerical study of the (2+1)-dimensional propagation dynamics of femtosecond laser pulses in silica. Pulses whose power is tens to hundreds of times higher than the threshold for self-focusing is split into multiple cones during its propagation. This new structure is formed as a result of the interplay of strong Kerr self-focusing and plasma defocusing. The number of cones increases with incident pulse energy. The uncertainty which may be contained in the evaluation of plasma response and multi-phase band-to-band transition cross section does not affect our results much.
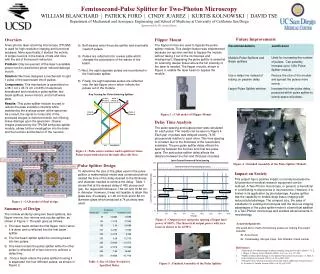
r 100 MW 〜 1 GW Silica glass 50 Pcr〜 500 Pcr z 0 7.5mm l= 800 nm Hyperbolic-secant pulse (T0 = 130fs) Gaussian beam (r0 = 200mm) High-power regime Intense laser pulse undergoes self- focusing due to the refractive index distribution induced by optical Kerr effect. Threshold power for self-focusing Pcr = 2.2 MW for silica. A few times Pcr has been used in existing studies for gas and solid Fig. 1 Focusing and propagation of high-power femtosecond laser pulse in silica, considered in the present study. In the present study, we consider the input pulse energy of 10 〜 150 mJ. High-power regime
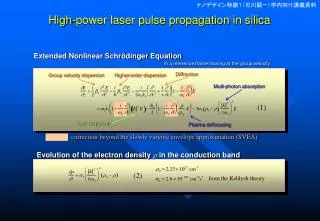
Diffraction Higher-order dispersion Group velocity dispersion Multi-photon absorption Kerr response Plasma defocusing correction beyond the slowly varying envelope approximation (SVEA) Evolution of the electron density r in the conduction band from the Keldysh theory Simulation model Extended Nonlinear Schrödinger Equation in a reference frame moving at the group velocity (1) (2)
Numerical methods The couples equations (1) and (2) are solved with the following methods. • Equation (1) • Split-step Fourier method [1] • Diffraction term : Peaceman-Rachford method [2] • Nonlinear terms (right-hand side) : 4th-order Runge-Kutta method • Equation (2) • 4th-order Runge-Kutta method [1] G.P. Agrawal, Nonlinear Fiber Optics, 2nd ed. (Academic, San Diego, 1995). [2] S.E. Koonin et al., Phys. Rev. C15, 1359 (1977).
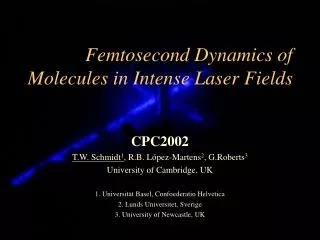
Radius r (mm) 3rd cone Self-focusing Self-steepening Plasma defocusing 5 0 10 6 0 3 9 10 0 5 15 Change of the spatio-temporal intensity profile with propagation input energy = 135mJ propagation distance z = 3200 mm 3300 mm 3400 mm 3500 mm 3600 mm (d) (e) (a) (c) (b) 1st cone 2nd cone 5000 mm 3700 mm 3800 mm 4000 mm 4500 mm (g) (f) (j) (i) (h) More than 10 cones Intensity (1012 W/cm2)
Multiple cone-like structure formation Self-focusing ⇨ The pulse energy is concentrated near the beam axis. Self-steepening ⇨ The peak is shifted toward the trailing edge. (a) As the self-focusing proceeds and the local intensity increases, Multi-photon absorption ⇨ Conduction (plasma) electrons are produced. Plasma formation has a negative contribution to the refractive index ⇨ Defocusing near the trailing edge. (b) Dramatic new feature in the high-power regime ! (c) Formation of a cone-like structure. (d)〜(j) With pulse propagation, more and more cones are formed. ⇨ Formation of multiple-cone-like structure.
3300 mm 3400 mm 1st cone 2nd cone Mechanism of the multiple-cone formation • At z = 3340 mm, the intensity decreases with increasing r in the range r = 9 - 12 mm, while Dn is nearly flat there. • Due to self-focusing, the first peak takes up much energy from its vicinity. • At z = 3360 mm, the second local maximum in Dn is formed around r = 11.3 mm. → The local self-focusing leads to the grow-up or the second cone. Fig. Radial distribution of intensity and refractive index change Dn at t = 44 fs.
Fluence vs. Propagation distance Self-focusing Propagation Propagation distance (micron) Propagation distance (mm) Radius (mm) Plasma defocusing Fluence (10-15 J/cm2) Fluence (10-15 J/cm2)
Multiple cone-like structure Temporal profile integrated in r-direction. FTOP signal z = 5000 mm from the silica surface Input energy = 135 mJ Integration in r Propagation Lateral profile Propagation Integration in time
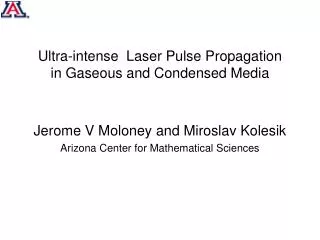
10 0 5 15 Dependence on the input energy Input energy With decreasing input pulse energy, • the number of cones decreases. • the cones are more parallel to the beam axis. The multiple-cone formation ceases when we further decrease the input energy. 135 mJ, z = 4500 mm 45 mJ, z = 5500 mm 15 mJ, z = 7000 mm Radius r (mm) Radius r (mm) Radius r (mm) Intensity (1012 W/cm2)
Uncertainty in plasma response and plasma formation rate Plasma response Plasma formation rate Intensity distribution at z= 4000 mm obtained with account of the saturation of conduction electron drift velocity, by replacing r/rcr in Eq. (1) by Intensity distribution at z= 3500 mm obtained with a value of s6 which is 100 times smaller than in Eq. (2). The uncertainty which may be contained in the evaluation of plasma response and multi-phase band-to-band transition cross section does not affect the essential features of our results. where Ith = 1012 W/cm2.
Conclusion • When the input power is several hundred times higher than Pcr, the pulse is split many times both temporally and spatially. • As a result, the intensity distribution contains multiple cones. This is a new feature that emerges only in thehigh-power regime • This structure is formed by the interplay of Kerr self-focusing and plasma defocusing.