Download
1 / 15
170 likes | 337 Views
Geological history exercise. Using seismic to deduce the geological history of an area. 300m. Horizon A. This seismic profile has horizon A identified at CMP 520 and TWT 450msec. Interpret this horizon and mark on any faults with arrows to show the displacement.

E N D
Geological history exercise Using seismic to deduce the geological history of an area
300m Horizon A
This seismic profile has horizon A identified at CMP 520 and TWT 450msec. Interpret this horizon and mark on any faults with arrows to show the displacement. What happens to the interpreted horizon at CMP 390? What is the strong feature at around 400ms that dips gently to the north? Use the laws of superposition and cross-cutting relationships to put the geological events you can see into the correct order.
300m S 450 Interpret the horizon at CMP 520 TWT 450msec
300m S ↾ ⇃ ⇃ ↾ ⇂ ↿ Add faults
300m CMP 390 S Unconformity surface ↾ ⇃ ⇃ ↾ ⇂ ↿ At CMP 390 the horizon stops against another horizon which dips to the north The red horizon is unconformable with the one above
300m S ↾ ⇃ ⇃ ↾ ⇃ ↾ ⇂ ↿ ⇃ ↾ ⇃ ↾ ↿ ⇂ Follow a second horizon to help see the rest of the faults
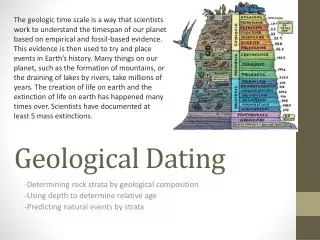
Geological History • Start with the oldest first. • Use the law of superposition: “If one sedimentary rock lies above the other then the upper rock is younger than the lower one”. • Use the law of cross-cutting relationships: “A rock or structure must be younger than any rock or structure which it cuts across”.
Geological History • The sedimentary sequence below 400ms would have been laid down as horizontal layers. It is now dipping to the south and so must have been subjected to deformation. • There is an unconformity at around 400ms which dips to the north. This represents a break in the geological sequence and an eroded surface, therefore deposition stopped and this area became a terrestrial environment. • There are several faults seen below the unconformity but not above and so they must have occurred before deposition resumed. These are normal faults which are caused by tensional tectonic forces. • It is possible that the cause of the normal faults was also the cause of the unconformity, with subsidence to the south causing a drop in sea level and so exposing the area to erosion. • At 400ms we see a younger sequence of rocks deposited on top of the unconformity which suggests the area was flooded again.
Extension Activity Can other sedimentary features be seen on seismic?
300m S ↾ ⇃ ⇃ ↾ ⇃ ↾ ⇂ ↿ ⇃ ↾ ⇃ ↾ ↿ ⇂ Look at the sediments above the unconformity The horizon has the shape of a depression. This could possibly be a channel, with the banks to the N and S.
300m S ↾ ⇃ ⇃ ↾ ⇃ ↾ ⇂ ↿ ⇃ ↾ ⇃ ↾ ↿ ⇂ The channel could have been flooded and infilled with sediment. To be sure we would need more evidence, from other seismic lines or a borehole.
300m S ↾ ⇃ ⇃ ↾ ⇃ ↾ ⇂ ↿ ⇃ ↾ ⇃ ↾ ↿ ⇂ How wide is the feature? It is approximately 1km wide
N Canvey Island London Bridge 10km In comparison, the Thames at London Bridge is approx. 265m wide, and 5km wide near Canvey Island
Conclusion • Sedimentary features are visible on seismic data. • To be visible on seismic data the feature must be large such as a river channel. • Detailed features such as cross-bedding are too small to see.