Download
1 / 45
450 likes | 698 Views
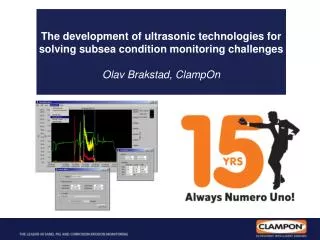
The development of ultrasonic technologies for solving subsea condition monitoring challenges. Going Subsea means new challenges. Subsea Trees Subsea Pumps Subsea Processing Subsea Manifolds Subsea Templates Subsea ROV Tie-in Systems Risers Pipelines. ClampOn.

E N D
The development of ultrasonic technologies for solving subsea condition monitoring challenges
Going Subsea means new challenges • Subsea Trees • Subsea Pumps • Subsea Processing • Subsea Manifolds • Subsea Templates • Subsea • ROV Tie-in Systems • Risers • Pipelines
ClampOn • Ultrasonic Intelligent Sensors • Sand Monitoring • PIG Detection • Leak Monitoring • Vibration Monitoring • Condition Monitoring • Corrosion-Erosion Monitoring • Well Collision Detector
The systems are installed down to thousands of meters water depth It costs a fortune in lost production if a sensor breaks down So how should a reliable system be designed? Design Life = 30 years
ClampOn’sSubseaPhilosophy Titanium body Jumper interface High pressure chamber with silicon oil Glass-metal penetrator Atmospheric chamber Electronic beam weldings No o-rings, gaskets or mechanicalseals!
Working Principle – Passive Acoustic sensors • An advanced “microphone” picking up signal at specific frequencies • Filters out noise not related to signal of interest(i.e. flow, mechanical noise etc.) • Non-intrusive design – can be retrofitted • Immediate results – real time readings • Used for sand, pig and leak detection
Sand Monitoring • Keep sand production under control!(planned or unplanned) • Optimize production (ref. MSFR and MASR) • Minimize sand removal cost • Avoid erosion issuesSafety, Maintenance cost, Environmental consequences • Avoid reservoir damageor even well collapse? • Always subsea on subsea trees!
What can a sand detector do? • Qualitative MeasurementNo need for other input –Standalone system • Sand AlarmFirst sand production, screen failure etc. • Sand production trendingFinding Maximum Sand Free Rate (MSFR) • Quantitative Measurement Requires input of flow data / flow speed • How much sand are you producing • Finding Maximum Acceptable Sand Rate (MASR)
Example; Subsea vs. Topside A comparison of the signals from the subsea- and the topside sensors - shows a significant difference in both signal amplitude and time!
ClampOn SandQ™ • Makes quantification of sand possible without external flow information input • Uses active transmission to measure velocity
SandQ™ – Subsea • SandQ will have the same basic design layout as the DSP Compact • Rated for 3000 Meters • SandQ™ subsea with same specifications as topside model • Simultaneous measurement of Particles, Flow and Vibration 3D • Designed for installation in existing funnel/clamp
Subsea PIG Detector Deepwater version Compact version
ClampOn DSP PIG Detector • Real time detection of PIG passing. • Can monitor the debris in-front / after the PIG when passing. • Indicates the efficiency of the PIG cleaning operation.
ClampOn DSP Leak Monitor • Identification of leaks from critical areas, primarily valves. • Quantifies leaks • Detects internal leaks in a valve • Can also be used on flanges, bends, joints etc. Picture 1, A Leak Monitor mounted on a PSV in the pressure bench at Statoils Kollsnes Refinery.
Case Challenge: • Two subsea 20” ball valves that have not been operated for 25 years! • The two flow lines have different pressure rating • Client need to increase the export in the flow line • The cross over should be closed and no cross-flow should be present – acceptance criteria was 5 SCM/h (similar to a new valve!) • The installation is at 200 meters water depth and all operations should be ROV operable
ClampOn Leak Detector w/data logger and Battery. Operates for 45 days. Dual element system 4 data point stored every minute Pressure tested to 200 Bar
Field results from cross over. Signal after removing ROV and bleeding off gas activity - what we have left is the leak signature. The leak rate is then calculated from this raw value level @ 32 dP Bar >8 -<32 SCM/h Conclusion: A minor leak in valve B
ClampOn DSP Vibration Monitor 3D • Measure G-forceDC – 1024 Hz3 axis X- Y -Z • Measure Acoustic Noise1 – 262 kHz
Vibration – WHY? • High wellhead pressure • Slugging / flow conditions • Subsea Pumps • Subsea Processing • Drill-thru operations at existing subsea wellhead • Collision… or different loading conditions • Condition Monitoring • Separate sensor or added function to other ClampOn instrument
Working Environment Uniform/General corrosion Pitting corrosion Erosion due to sand or chemicals Crevice corrosion Selective attack/leaching corrosion DSP Corrosion-Erosion Monitor
History • 2004 First Version • Piezoelectric transducers • Transducers glued onto flow line • 2007 Second Version • EMAT transducers • No coupling between transducers and flow line (dry contact) • 2010 Subsea Version • Second version marinized
What Does it do? • Real-time monitoring of average wall thickness • Covers up to 60% of measuring area • Measures up to 56 individual paths • Detects changes larger than 1% of WT
How does it work? • Non intrusive, dry contact transducers • Electro Magnetic Acoustic (EMAT) • Acoustic Guided Lamb Waves (AGLW)
The CEM does not only measure the wall thickness directly in-between the two transducers – a wider area is monitored. Coverage area is dependent on transducer separation, wall thickness, frequency and sound velocity. Signal interpretation – Coverage area
Subsea configurations • Pre installed • ROV installed • Fully interfaced • Battery powered • Internal data storage • Charged by ROV • Wireless communication
Pre installed • Transducers installed topside • Main unit (processor) installed/retrieved by ROV
Retrofit All components installed by ROV
Challenge; The existing intrusive system is not working The field starts producing particles… Water Depth 600 meters Field case – Retrofit subsea sand monitoring
ROV operable basket with Clamp/funnel, harness, battery and data logging
High Flexibility • Non-intrusive, cost-effective installation • ROV Retrofit • Designed for 4500 meters depth • Battery pack & internal logging • Multifunctional (Sand, PIG, vibration etc.)
Questions? Olav Brakstad Sales Manager ClampOn AS olav@clampon.com www.ClampOn.com
ClampOn Ultrasonic Spectrum Analyzer “Well Collision Detector”
Experience • Previous experience has proven that ClampOn topside sensors can detect down hole events. One example would be the detection of perforation guns firing at depths of 13,000 to 15,000 feet • The collision risk mitigation procedure was also recently put into operation by a major operator in the Gulf of Mexico with great success
Procedural Goals • Prevent drill bit from colliding with existing well casing during sidetrack drilling operations • Give engineers physical proof of drill strings proximity to existing wells • Prevent environmental damages caused by collision • Help to increase safe drilling speed and decrease downtime caused by collisions
Easy non-invasive installation of hardware No hot work permit required Intrinsically safe sensor No production shut-down to install Minimal impact to daily operations on the platform Mounted on conductor pipe Installation
Topside sensor monitors ultrasonic signals generated by drill string Sensors are mounted on existing wells which will be in close proximity to drill bit Ultrasound is digitized allowing for frequency analysis in real-time Operation
Establishing a Base Line • Raw value readings are monitored throughout drilling operation • ClampOn tech’s establish base line values as drill string progresses • The lowest values will be seen prior to milling operations
Milling Operations - Base Line Readings • Significantly higher raw value signals will be detected as the mill cuts through the casing • Data collected at this point will be vital in determining the drill bits proximity to existing wells
Sidetrack Drilling Begins • Raw value signal will decrease after completion of milling operation • ClampOn tech’s begin 24 hour monitoring as drilling continues • Dramatic increases in raw value readings will be closely monitored
Topside sensors mounted on the existing well will begin to detect higher ultrasonic noise Raw value signals will begin to increase ClampOn tech’s can now notify drillers of collision risk level Drill Bit Approaches Existing Well
Real time generated trends from frequency data are closely compared to engineers normal risk mitigation calculations Raw value trends are analyzed and collision seems possible When the signal continues to increase, drilling is halted After further analysis the drill bit is repositioned to veer away from the corresponding well and drilling is resumed and possible collision averted Collision Averted