Evaluating Mesoscale Weather Events using CrIS and ATMS Observations via Rapid Prototyping
This study investigates the impact of new satellite observations from the Cross-track Infrared Sounder (CrIS) and Advanced Technology Microwave Sounder (ATMS) on the numerical modeling of mesoscale weather events, specifically a squall line affecting the Gulf Coast. Using the ECMWF and MM5 models, various data assimilation experiments were conducted to assess the improvements in temperature and moisture profiles. Results show that incorporating CrIS and ATMS datasets enhances forecast accuracy and provides critical insights for operational weather prediction.

Evaluating Mesoscale Weather Events using CrIS and ATMS Observations via Rapid Prototyping
E N D
Presentation Transcript
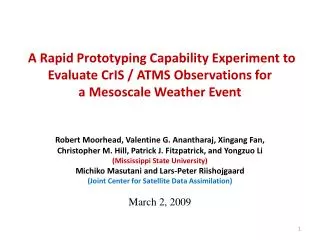
A Rapid Prototyping Capability Experiment to Evaluate CrIS / ATMS Observations fora Mesoscale Weather EventRobert Moorhead, Valentine G. Anantharaj, Xingang Fan,Christopher M. Hill, Patrick J. Fitzpatrick, and Yongzuo Li(Mississippi State University)Michiko Masutani and Lars-Peter Riishojgaard(Joint Center for Satellite Data Assimilation)March 2, 2009
General Overview • National Polar-orbiting Operational Environmental Satellite System (NPOESS) to be launched in 2013 • preceding NPOESS Preparatory Project (NPP) to be launched in 2010 • component sensors of NPOESS and NPP to include: • Advanced Technology Microwave Sounder (ATMS) • across track scanning microwave radiometer • cross-track resolution: 15.0 km • Cross-track Infrared Sounder (CrIS) • Fourier transform spectrometer • cross-track resolution: 14.0 km • vertical resolution: ~ 3.0 km • Combination of ATMS / CrIS should improve profiles of T and q • Mesoscale OSSE needed to assess the impact of ATMS / CrIS 2
ECMWF (ATMS / CrIS) adapted from NCEP model of OSSE NWP OSSE Methodology 3
Mesoscale Case event identified from ECMWF T799 NRMay 2 - 4: squall line affecting all points along US Gulf coast 3-hour total of precipitation (mm) 12 UTC 2 May 18 UTC 2 May 00 UTC 3 May mean-sea-level barometric pressure (hPa)
MSU OSSE Approach • Objective: investigate the impact of new satellite data observations on the numerical model representation of a regional weather event • Case event: squall line system of thunderstorms affecting the Gulf Coast • Regional Scale Nature Run (RSNR) using MM5 model • one-way nested grid set, with ICs and BCs from ECMWF NR data • Sensitivity experiments • use second model (WRF) to avoid similarity in model error (fraternal twin problem) • WRF model calibrated with background errors • Steps involved in data assimilation experiments • Cold start simulation (no data assimilation) • First assimilate synthetic surface, rawinsonde observations • Then assimilate data representing ATMS / CrIS • use RTM to simulate sensor-observed radiance, assimilate derived Tandqprofiles
Region Scale Nature Run (RSNR) ECMWF NR grid (global) MM5 NR grid (regional) L forecast hour-15 surface temperature forecast hour-15 1-hour precipitation • The MM5 simulates the virtual atmosphere, based on the ECMWF NR, within a limited area • MM5 RSNR performed over duration of the weather event, or about 72 hours Map image adopted from Shuttle Radar Topography Mission
Data Assimilation Experiments (1) ECMWF NR grid (global) • boundary conditions (BCs) restrain the solution of the inner model • BCs from ECMWF NR and MM5 RSNR are modified to prevent “contamination” of WRF results MM5 NR grid (regional) MM5 NR grid ECMWF NR grid MM5 nest grid unperturbed BC L MM5 nest unperturbed BC WRF nest WRF nest grid perturbed BC • As the MM5 nest simulates the virtual atmosphere, the WRF nest simulates a realistically imperfect solution of the atmosphere • Simulation of the nest grids provides greater detail of the weather event, which is necessary for creating synthetic satellite observations from MM5 and assimilating these observations into the WRF model Map image adopted from Shuttle Radar Topography Mission
Data Assimilation Experiments (2) ECMWF NR grid (global) MM5 NR grid (regional) MM5 nest grid L MM5 forecast hour-15 1-hour precipitation WRF nest grid • The assimilation of ATMS/CrIS data should improve the WRF solution and reduce forecasting error relative to MM5 results (truth) WRF forecast hour-15 1-hour precipitation • Specific fields, such as precipitation, will be evaluated for impact from the synthetic ATMS/CrIS dataset through model experiments that include, and exclude, this dataset Map image adopted from Shuttle Radar Topography Mission
Case event from ECMWF T799 nature run Simulated squall line is focus of our regional nature run (T799 NR)
Regional Scale Nature Run (RSNR) with MM5 MM5 9 km • 9-km domain 521 × 553 × 30 • 3-km domain 511 × 661 × 30 • One-way nesting from 9- to 3-km grid • Initial and boundary conditions from ECMWF T799 NR • Integration period: 00 UTC 02 May to 00 UTC 04 May • Parameterizations: • simple ice microphysics • Blackadar PBL • Kain-Fritsch cumulus (9-km domain) • no cumulus scheme (3-km domain) MM5 /WRF 3 km
Simulation Results of MM5 9-km grid of RSNR 10-m wind hourly precipitation
Simulation Results of MM5 3-km nest grid of RSNR 10-m wind Precipitation
Sensitivity experiments with WRF MM5 9 km • 3-km domain 511 × 661 × 30 • Initial and boundary conditions from MM5 9-km [ regional nature run ] • One-way nesting from MM5 9-km grid • Integration period (cold start run): 00 UTC 02 May to 00 UTC 04 May • Parameterizations: • no cumulus scheme • simple ice microphysics • YSU PBL • Synthetic observations assimilated using WRF-VAR during 00 UTC to 12 UTC 02 May MM5 /WRF 3 km
Model background error calculation • background errors were calculated between successive 24-h WRF simulations initialized with ECMWF T799 data from April 12 – May 14 • errors of a quantity are computed between different forecast cycles (Parrish & Derber 1992) • background errors used to calibrate the experimental WRF simulations
Synthetic observations are extracted from MM5 3-km grid simulation. 36 hours 00Z02 03Z02 06Z02 09Z03 12Z02 00Z 04 WRF 3DVAR cycling WRF simulation From 00Z 02 to 12Z 02 WRF 3DVAR cycling is made to assimilate “true data” of synthetic observation from MM5 3-km. WRF 3DVAR Cycling and Simulation
Data Assimilation – Synthetic Observations Synthetic observations are taken from MM5 3-km grid. 02 May 02 May 02 May 02 May 02 May 00 UTC 03 UTC 06 UTC 09 UTC 12 UTC SFC SFCSFCSFCSFC UA SAT UA WRF 3DVAR cycling every 3 hrs Synthetic satellite coverage 5-minute ATMS / CrIS swath Sites of synthetic surface obs Sites of synthetic UA soundings
In Progress: Satellite data assimilation Synthetic satellite observations of T and Td are taken from MM5 3-km grid. 02 May 02 May 02 May 02 May 02 May 00 UTC 03 UTC 06 UTC 09 UTC 12 UTC SFC SFCSFCSFCSFC UA SAT UA WRF 3DVAR cycling every 3 hrs Synthetic satellite coverage 5-minute ATMS / CrIS swath Procedure: Synthetic ATMS / CrIS data available within 3-km grid area from 0730 UTC to 1000 UTC on 02 May Synthetic ATMS / CrIS data are thinned to closely match MM5 3-km grid points MM5 T and Td are matched to ATMS / CrIS swath points across the MM5 model grid, and matched to MM5 vertical levels New synthetic satellite observation dataset is assimilated at 0900 UTC in WRF 3DVAR, with appropriate errors added: T (± 1K) Td (± 2K)
Comparison of MM5 and WRF Simulations A comparison of simulation results from MM5, WRF with no data assimilation (cold start), and WRF with assimilation of synthetic surface and upper-air observations is made in this section. Only subtle differences are seen between the MM5 and WRF results. Hourly precipitation, sea level pressure, and 2-meter dew point temperature are compared in following slides.
MM5 WRF 3DVAR WRF 18 UTC 02 May: The locations of precipitation areas simulated by WRF and MM5 are close. However, the patterns of the precipitation areas differ between WRF and MM5 over the Gulf of Mexico.
MM5 WRF 3DVAR WRF 21 UTC 02 May: WRF and MM5 each simulate precipitation along the Louisiana coast. Differences in the precipitation pattern exist over the Gulf of Mexico and over Tennessee.
MM5 WRF 3DVAR WRF 00 UTC 03 May: Precipitation fields of MM5 and WRF are close. Rainfall band of MM5 moves a little faster than that of WRF. The pattern and position of precipitation area from WRF DA run is more similar to the WRF cold start.
MM5 WRF 3DVAR WRF 03 UTC 03 May: Precipitation fields of MM5 and WRF are close. Rainfall band of MM5 still moves a little faster than that of WRF. The pattern and position of precipitation area from WRF DA run is more similar to the WRF cold start.
Summary of Results & Discussions • Successful and fruitful collaboration with JCSDA and the International Joint OSSE Working Group (J-OSSE WG) • Access to ECMWF nature runs • Periodic WG meetings and discussions, including 2 formal presentation about the ATMS/CrIS OSSE and RSNR to the J-OSSE WG • 3 conference publications so far • Design, configuration, and synthesis of RSNR • New approach with many uncertainties; approach seems to be promising; and adds to the body of knowledge • Many challenges in using WRF 3DVAR being addressed systematically • Satisfactory level of progress • Still many uncertainties in adopting WRF radiance assimilation; code release behind schedule at NCAR. Will be ideal to use NCEP GSI; but requires steep learning curve & beyond scope (recommended for suture effort). NASA RPC Review (3/2/09)
Summary of Progress • Completed Tasks • Mesoscale OSSE experimental design • Regional Scale Nature Run (RSNR - synthetic truth) using MM5 • Retrieval of temperature (T) & dew point (Td) profiles • Control run using WRF • Data assimilation experiments using WRF-3DVAR • WRF background error estimation, necessary for 3DVAR assimilation • Assimilation of (synthetic) surface and upperair observations • Preliminary DA run using WRF-3DVAR • Final Steps (in progress) • Additional DA runs and validation of DA run(s) • Error analysis • Final evaluation (document and publish) NASA RPC Review (3/2/09)