Download
1 / 50
500 likes | 626 Views
Better decision making in presence of faults: formal modelling and analysis. Professor Muffy Calder Dr Michele Sevegnani. Computing Science. Better decision making in presence of faults: do I need to fix a fault now or can I wait until tomorrow?. Professor Muffy Calder FREng

E N D
Better decision making in presence of faults: formal modelling and analysis Professor Muffy Calder Dr Michele Sevegnani Computing Science
Better decision making in presence of faults: do I need to fix a fault now or can I wait until tomorrow? Professor Muffy Calder FREng Dr Michele Sevegnani Computing Science
A stochastic event-based model and analysis of the NATScommunications links monitoring system Professor Muffy Calder Dr Michele Sevegnani Computing Science
Outline Who am I Part I Why model; what to model Part II How to model and analyse Part III Results for example sites and sectors; inference from field data Decision making Part IV Implementation and GUI; how to use the model(s) Part V Conclusions; next steps
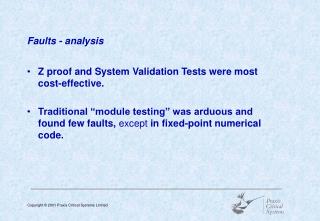
Domestic Network and Policy Management • real-time analysis of policies and configurations – spatial and temporal (on router) • Feature interactions in advanced telecomms • logical properties (off-line, on-line) • Homecare sensor system: assessing configurations for usability, interaction modality • real-time logical analysis (on system hub) • Populations of users of ubiquitous computing/mobile apps • stochastic models and logical analysis of actual use – from user traces • Cellular biology • signalling pathways for coordination/cancer; phosphorylation is signal Who am I - Related work
Part I: Why model Motivation engineering team maintain large number of complex systems, many different management systems, reliance on experience a low level fault can give rise to a plethora of alarms systems do not allow easy visualisation, interrogation of current state, or prediction of future need to quantify criticality or urgency need to relate asset behaviour to service behaviour
Why model Event based, stochastic modelling based on monitored behaviours quantify service quality across different sectors and dynamically changing assets/systems experiment with different monitoring strategies and system architectures experiment with different strategies for repair and maintenance visualise criticality better decision making: ATC users, engineers, technical staff, management Quantifyhow system is designed to meet requirements actually meets requirements
Why model Analysis allows us to answer questions like: What is probability of no service from a given degraded configuration in a given frequency/sector/site over next 48 hours? What proportion of time is the service functioning, in the long run? sector RRR mean repair times: 20h, 15h
Why model Analysis allows us to answer questions like: What is probability of no service from a given degraded configuration in a given frequency/sector/site over next 48 hours? What is the effect of an intervention?
What to model Monitoring Systems radar - communication links - oceanic routes - local machines - voice - weather - power lines Communication links monitoring civilian, military, emergency, oceanic frequencies sectors, sites, frequencies and channels 35 sectors, each with set of frequencies (+ emergency) 17 sites, each with antennas (channels) that (send) Tx and (receive) Rx on different frequencies redundancy: a frequency is covered by more than one site each site has main channel A and backup channel B site environment: powerline status, comm link status, flooding, intrusion
What to model Monitoring system colour codes Greenfunctioning Red faulty -- alarm goes off Blue under maintenance Amber not fully functioning/reduced redundancy (e.g. a frequency when one antenna is down) We model sectors (comprising) sites ( comprising) channels
What to model Event-based, parameterised model parameters: - number of sites in a sector - rates of events in a site - state of Tx and Rx in a site assumptions: - events are independent, unless explicitly linked
Overview of project Prediction Predictive temporal properties e.g. transient probability of no service PRISM model checker Parameterised Model CTMC for counter abstraction of subsystem Field Data PRISM model checker GUI Event Rates inference Validation Predictive temporal properties e.g. steady state probability of no service, reduced redundancy, etc. Static Analysis possible action(s) Safety Cases Business Cases
Part II: How to model Principles model observed/recorded events between discrete states an events occurs with a rate rate determines probability of reaching a state by a given time possibility of race conditions k l
How to model Principles model observed/recorded events between discrete states an events occurs with a rate rate determines probability of reaching a state by a given time possibility of race conditions At rate k: Continuous time Markov chain
S S serviceable F faulty M under maintenance Simple Example: Markov chain rate1 rate2 A Markov chain has no memory. A rate only depends on the current state, not how we got to a state. F We can reason about paths. We can reason about the probability, over time, to reach a state. e.g. what is probability to reach state M in 4 hours? rate3 rate4 M
SS Overview of model S serviceable F faulty M under maintenance SF SM channel component: (counter abstraction) A and B channels Tx or Rx FF FM MM A/B CHANNELS
SS Overview of model S serviceable F faulty M under maintenance reduced redundancy SF SM channel component no service FF FM MM A/B CHANNELS
SS E Overview of model S serviceable F faulty M under maintenance E external site failure SF SM channel component FF FM MM A/B CHANNELS
Overview of model E0 S serviceable F faulty M under maintenance E external site failure E1 site environment component E2 Synchronise red events green events SITE ENVIRONMENT
Overview of model A site consists of 3 concurrent components: Tx, Rx, Env At any moment, a site is in a configuration Examples: (SS,SS,E0) green - serviceable site (SF,SS,E1) amber - reduced redundancy site (FF,*,*) red - reduced redundancy site NB: Not all configurations are reachable. S serviceable F faulty M under maintenance E external site failure
Overview of model Every component is represented in PRISM by a generic module. Modules for channel (pair) site environment site n-ary sector (n= 2…5) Rates of events vary from site to site (sector to sector).
Analysis Use (stochastic) logic for analysis to validate long run behaviour against (long run) observations What is the % time in a no service state? E.g. 8.5 E -4 What is the % time in a reduced redundancy state? E.g. 30% predict a transient behaviour What is the probability of being in a no service state over the next t hours? P =? [F<=T noservice_sector(X)] How does the probability change over those t hours? How does the probability distribution depend on the current state? Possible action: If the prediction from the current state is unacceptable, then change state to one with a more acceptable prediction.
Transient behaviour from which current state? Distance (in time) to no service configurations depends on current configuration The colour code adopted by the monitoring system does not allow to quantify this distance or to compare possible current configurations. The model allows us to do this! TIME
Transient behaviour from which current state? Distance (in time) to no service configurations depends on current configuration The colour code adopted by the monitoring system does not allow to quantify this distance or to compare possible current configurations. The model allows us to do this! TIME
Transient behaviour from which current state? Distance (in time) to no service configurations depends on current configuration The stochastic model allows to measure the distance precisely: TIME
Transient behaviour from which current state? Distance (in time) to no service configurations depends on current configuration Important: distance does not depend on the number of transitions but on the rates on the transitions. TIME
Part III: Analysis results for example sectors/sites Example sector with three sites FIR sector (sites CGL, WHD and LWH). Each site consists of the synchronisation of two channel components (Tx/Rx) and a site environment component. Total number of components for FIR: 6 channels and 3 environments. Event rates are inferred from historical data (Feb 2012 – Feb 2013) - maintenance and failure data for FIR sector and individual sites. Analysis of the transient behaviour from different sector states Out of all the possible configurations (389,017 states) we compare the expected behaviour of selected states over the next 48 hours. A state represents a configuration of a sector, e.g. three sites, two of which are serviceable and one is no service.
Inference from field data All the events occurred in sector FIR from Feb 2012 to Feb 2013 are counted and categorised Total number of alarms: 61 Total number of site events: 24 Events are used to derive transition rates: Mean inter-failure time: 452 h Mean repair time: 23 h Response: 57 m Site event: 1107 h Percentage of quick repairs: 15% Site failure: extremely rare event 1 every 11.33 years
Analysis results for example sectors/sites W= serviceable (working) site R = reduced redundancy site N = no service site Selected sector configurations Configuration Wcorresponds to configuration (Tx,Rx,Env) = (SS,SS,E0) Configuration N corresponds to configuration (Tx,Rx,Env) = (FF,*,*), (FM,*,*), (MM,*,*), (E,E,E2) Configuration R corresponds to configuration (Tx,Rx,Env) = (SF,(SM|SF |SS),(E0|E1)), (SM,(SM|SF |SS),(E0|E1))
Examples And how to interpret results….
Steady state for example sectors/sites No Service is 1.03E-8
Validation Compare historical data (over 1 year) model steady state analysis Historical data Steady state analysis
Analysis results for example sectors/sites Prediction of sector FIR from states (W,W,W), (W,W,R), (W,W,N)
Analysis results for example sectors/sites Prediction of sector FIR with states (W,R,R), (R,R,R)
Analysis results for example sectors/sites Prediction of sector FIR with states (R,N,N) (W,R,N), (R,R,N), (W,N,N),
Decision making Make an intervention to move into a better state.
Decision making Analysis from RRR solid line, mean repair time is 20 hours (unsafe at 20 hrs) dashed line, mean repair time is 15 hours (unsafe at 34 hrs) WRR is state with one site repaired
Decision making WRR dashed line – under standard assumptions solid line, site repaired after 20 hours 20 = random value when mean repair time is 15 hours
Decision making- real-time support Idea: catalogue of scenarios and interventions
PRISM is freely available software www.prismmodelchecker.org (32/64 bit Windows, linux, MacOS -- Java) Part IV: Implementation Implementation of the model in PRISM (probabilistic model checker) Source code is a text file Example moduleChannel_A_Tx status_A_Tx: [0..4]; //0 = servicable, 1 = faulty, 2 = repairing, 3 = under maintenance, 4 = site-event [] status_A_Tx =0 -> rate_failure:(status_A_Tx'=1); [] status_A_Tx =1 -> rate_ack:(status_A_Tx'=2); [] status_A_Tx =2 -> rate_repair:(status_A_Tx'=0) + rate_send_fix:(status_A_Tx'=3); [] status_A_Tx =3 -> rate_fix:(status_A_Tx'=0); [event] status_A_Tx =0 | status_A_Tx =1 | status_A_Tx =2 -> (status_A_Tx'=4); [fix] status_A_Tx =4 -> (status_A_Tx'=0); endmodule
GUI Client-server architecture based on a nodejs web server and a web interface.
Select the number of sites in the sector How to use the model(s) Set the rates Select initial configuration and duration for a predictive model Tick this box for a steady state analysis
Scheduled maintenance The model assumes stochastic failure rates Combined failures Failure events in the Tx and Rx modules are assumed independent However, only 16% of the faults (over the entire dataset) affect only one module Quick repairs The entries of the database do not record if the fault was repaired locally (quick repair) or if an engineering team call was required Even when a fault is fixed quickly locally, the equipment is often monitored for some time Site failures More data is required for statistical significance. Positive result: the data confirms these are extremely rare events. More on field data
What we have done • Entire framework is implemented • Instantiated for communications subsystem • Parameterised model driven by a bespoke GUI • Parameter instances derived from field data • Model validation, leading to … • Model as predictor “can I wait 4 hours to fix problem at site X?” • What we uncovered • Some issues about field data • retrieval from SAP • formats for recording (free text) • What we published • “Do I need to fix a failed component now, or can I wait until tomorrow” • Submitted to: 10th European Dependable Computing Conference Conclusions
1. Field data • More data – longitudinal and spatial • Automated inference from data, every time dataset updated • Automated updating of model from inferred rates • Fully automated, self-updating model of monitoring system • 2. Extend model to more sectors, subsystems etc • model all sectors; model all subsystems • include spatial aspects; frequency redundancy • 3. Decision making • Role of online model; catalogue of scenarios • 4. Modify model • dependent events and scheduled maintenance • experiment with other types of formalisms • 5. Feedback into other processes • alignment with safety and business cases; SLAs; ticketing Next steps