Enhancing Biodiversity in Agricultural Landscapes: Predicting Impacts of Row Crop Strategies
10 likes | 109 Views
Develop a biodiversity metric to educate producers on effects of agricultural practices on vertebrate species. Model enables comparisons and informed decisions. Expert-based approach allows exploration of biodiversity impact and diverse queries.

Enhancing Biodiversity in Agricultural Landscapes: Predicting Impacts of Row Crop Strategies
E N D
Presentation Transcript
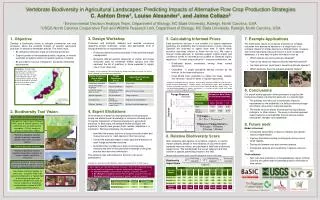
Vertebrate Biodiversity in Agricultural Landscapes: Predicting Impacts of Alternative Row Crop Production Strategies C. Ashton Drew1, Louise Alexander1, and Jaime Collazo2 1Environmental Decision Analysis Team,Department of Biology, NC State University, Raleigh, North Carolina, USA 2USGS North Carolina Cooperative Fish and Wildlife Research Unit, Department of Biology, NC State University, Raleigh, North Carolina, USA • 3. Design Workshop • Producers and biologists debated and reached consensus regarding project objectives, scope, and appropriate level of biological detail for an educational tool. • Producers defined common practices in field and field margin management. • Biologists defined general categories of shelter and forage resources used by vertebrate wildlife species and then narrowed the list of practices to those expected to impact one or more resources. • 7. Example Applications • The biodiversity impact score allows producers to compare outcomes from alternative decisions in a single field, or to compare impacts of similar decisions in different fields. However, even more importantly, because the tool is built on relational databases, it is very easy to query information such as: • Which species are most positively impacted? • How do my decisions impact culturally important species? • Are there actions I could take to benefit a particular species? • Which decisions have the greatest potential impact? • 5. Calculating Informed Priors • Each production decision is one variable in a logistic regression predicting the probability that a field provisions a given resource. (Species are assumed to spend more time in fields which provision resources relative to those that do not.) We used a mixture model approach to translate experts’ simple impact and confidence scores to informed priors suitable for Bayesian logistic regression. For each unique decision – resource combination, we: • Distributed expert uncertainty among three normal distributions. • Calculated a single probability density function as the mixture of the three distributions. • Used Monte Carlo estimation to obtain the mean, median, and variance values for betas in logistic regressions. • 1. Objective • Develop a biodiversity metric to educate commercial row crop producers about the potential impacts of specific agricultural practices on terrestrial vertebrate species. The metric must: • Be relevant to decisions made by individual producers. • Support queries of the expected positive, negative, or neutral outcomes of specific actions for specific species of interest. • Be grounded in science, transparent, and easily interpreted by producers. Study Area: The pilot study focused on corn, wheat, cotton, and soy crops in portions of three states (VA, NC, SC) and three ecological regions. The model allowed “typical” farming practices and species resource preferences to differ among states and ecoregions. Examples of the categories defined through the design workshop to illustrate the level of detail selected to meet educational objectives. 4 1 7 Example of probability density functions and resulting estimates of beta for two decision – forage resource combinations. Experts’ impact and confidence scores were encoded into the prior formulation (red line) as a mixture of three normal distributions (black lines). The final predicted probability of species occurrence is a function of both shelter and forage resources, treated as independent events. 1 2 8 2 5 • 8. Conclusions • Our expert-based approach allows producers to explore the biodiversity impact of production decisions in a specific field. • The pathway from decision to biodiversity impact is represented as the probability of a field provisioning forage and shelter resources to individual species. • The model structure allows diverse queries by producers, biologists, or other citizens. The query outcomes represent expert-based prior probabilities that are science-based, transparent, testable, and updateable. 3 3 6 9 Forage Resource • 4. Expert Elicitations • In the absence of empirical data appropriate to the proposed scope, we elicited expert knowledge to construct informed priors for logistic regressions of species responses to agricultural practices. In each state, we selected wildlife biologists with expertise in specific taxa groups (birds, reptiles, amphibians, or mammals). Working individually, the biologists: • Identified the primary (by time utilizing resource) shelter and forage resource for each species in their taxa group. • Scored the expected impact of each agricultural practice on each forage and shelter resource. • Quantified their confidence in each score response, reflecting the level of their personal knowledge of the given practice and resource combination. • The elicitation was administered in the form of an excel spreadsheet. 2. Biodiversity Tool Vision P (Forage) = β0 + βCorn + βLeaveResidue + … Producer identifies field of interest Tool queries Gap Analysis Program (GAP) data to identify species that potentially use the field and the immediate (120 m) margin as primary or secondary habitat • 9. Future work • Model refinement: • Incorporate seasonality of resource impacts and species resource dependence. • Improve statistical encoding to distinguish strong versus weak impacts. • Distinguish between rare and common species. • Incorporate variance and uncertainty in species resource use. • Field validation: • Test multi-taxa predictions in the Appalachian region of North Carolina and gather data to generate posterior estimates of beta values. P(Species | Forage,Shelter) = P(Forage) + P(Shelter) – P(Forage ∩ Shelter) Decision • 6. Relative Biodiversity Score • After assigning each species to a positive, negative, or neutral impact category, based on the probability of occurrence given expected resource values, we calculated a field-level biodiversity impact score. We standardized the scores relative to the total number of species potentially present in the field. Relational database matches species to primary resources (forage, day shelter, and night shelter) Producer describes practices Relational database matches practices to positive, negative, or neutral impacts to primary resources Example of a question posed to biologists about the management of the field margins. Equation used to calculate impact score with examples to illustrate score range. • In your region, as mowing frequency increases, what is the expected impact on the probability of presence of species that primarily forage on _______? • +1 Increase probability of presence of species using this resource • 0 No change in probability of presence of species using this resource • - 1 Decrease probability of presence of species using this resource # Positively Impacted # Negatively Impacted # Neutrally Impacted 2*( ) - 2*( ) + Biodiversity Impact Score = Relational database assigns impact scores to individual species based on their assigned primary resources # Species Tool scores individual species as more, less, or equally likely to be present (compared to a “typical” field of the same crop type) and calculates a biodiversity score as the net response of all species standardized to number of GAP species potentially present.


![JOB PROFLING EXPERT [JP EXPERT]](https://cdn3.slideserve.com/6713383/job-profling-expert-jp-expert-dt.jpg)