Download
1 / 28
280 likes | 445 Views
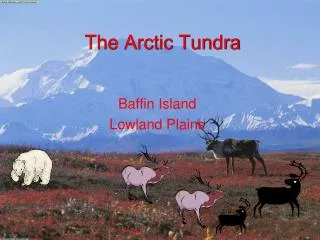
Summary: Functioning of ecosystems varies predictably with climate. Combination of temperature and precipitation. II. Changes in climate. A. Yearly ( interannual ) B. Millennial scales C. Human impacts. - Is global warming for real?

E N D
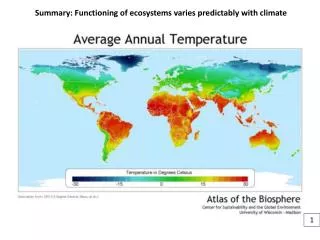
Summary: Functioning of ecosystems varies predictably with climate
II. Changes in climate A. Yearly (interannual) B. Millennial scales C. Human impacts - Is global warming for real? - How do we know that it isn’t just a natural fluctuation in temperature? - What are some of the forces that lead to natural climate variability?
II.A. Interannual Variation – El Niño Southern Oscillation - The Pacific Ocean strongly influences the global climate system because it is the largest ocean basin - Normal ocean current and wind direction in central Pacific is easterly
ENSO events result from weakening of tropical Pacific atmospheric and oceanic circulation Climatic connections carry these climate effects throughout the globe (e.g., El Niño creates warm winters in Arkansas and lots of rain in California) ENSO occurs every 3-6 years with severe events every 8-15 years. http://www.youtube.com/watch?v=IvmeUStFvz8
II. B. Millennial scale variation Changes in orbit cause long-term variations in solar input to Earth Shape of orbit (100,000 years) Wobble of tilt (23,000 years) Angle of tilt (41,000 years)
Eccentricity: The Earth's orbit around the sun is an ellipse. The shape of the elliptical orbit, which is measured by its eccentricity, varies through time. The eccentricity affects the difference in the amounts of radiation the Earth's surface receives at aphelion and at perihelion. When the orbit is highly elliptical, one hemisphere will have hot summers and cold winters; the other hemisphere will have warm summers and cool winters. When the orbit is nearly circular (now), both hemispheres will have similar seasonal contrasts in temperature.
Rotation axis executes a slow precession with a period of 23,000 years (see following figure) Pole Stars are Transient Wobble inthe tilt
Precession: Present and past orbital locations of the Earth during the N Hemisphere winter
Milankovitch cycles • The interactive effects of Earth’s orbital variation on timing and distribution of total solar input. • Strong effect on glacial/interglacial cycles http://en.wikipedia.org/wiki/Image:Vostok_420ky_4curves_insolation.jpg http://www.youtube.com/watch?feature=player_embedded&v=L2m9SNzxJJA
D. Human effects Earth’s climate is now warmer than at any time in the last 1000 years • Global warming
How can the atmosphere warm? 1. Increased solar input 2. Less reflected shortwave, less sulfate aerosols, darker surface of Earth (land-cover change) 3. More absorbed longwave more “greenhouse gases”
Most major greenhouse gases are increasing in atmospheric concentrations
Earth’s climate is now warmer than at any time in the last 1000 years 1. increased solar input (small warming effect) 2. Increased sulfate aerosols reflects radiation (small cooling effect) 3. Increased greenhouse gas concentrations (large warming effect) 4. Land-cover change creates a darker surface (large warming effect)
Climate is warming most rapidly at high latitudesThis warming is most pronounced in Siberia and western North America
Case Study: Agriculture • Question: Why do we care about Global Climate Change in Champaign, IL? • What is central Illinois good at?
SoyFACE • Dr. Carl J. Bernacchi at the University of Illinois studies how increased atmospheric CO2 and temperature affects how corn and soy grow • Higher temperatures have a negative effect on growth and physiology of soybean. The effect of temperature, however, was offset when CO2 was increased simultaneously with temperature. The benefit of combined increases in CO2 and temperature were less than predicted. http://www.igb.illinois.edu/soyface/sites/igb.illinois.edu.soyface/files/uploads/UrsulaRuiz2010.pdf
Changing Climate Conditions • Temperature increases: longer growing seasons, less frost, warmer nights • Precipitation changes: deficits, excesses, timing shifts, changing mix of rain/snow • Increased intensity of precipitation events: more flooding and more droughts • Increasing carbon dioxide concentrations
Effects and Sensitivity Vary by Commodity • Corn: high nighttime temperatures, high temperatures during pollination, water stress • Soybean: water stress, high temperatures • Wheat and small grains: extreme events, frost during flowering, water stress • Rice: temperature extremes during pollination, water management • Cotton: high temperatures during boll fill • Pasture and rangeland: water stress • Fruit trees: chilling requirements not met, high temperatures during fruit development • Specialty crops: water stress, high temperatures
Agriculture is the source of 30% of total global human impact emissions of GHGs • Particulate matter & GHGs from land clearance by fire & burning of residues • > ½ total global anthropogenic emissions of CH4 and N2O • CH4: from rice & livestock production • N2O from fertilizers & manure (FAO 2003, Gomiero et al. 2008) laobumpkin.blogspot.com www.dowagro.com www.ncagr.gov
Particulate matter & GHGs from land clearance by fire & burning of residues • > ½ total global anthropogenic emissions of CH4 and N2O • CH4: from rice & livestock production • N2O from fertilizers & manure laobumpkin.blogspot.com www.dowagro.com www.ncagr.gov
Other sources: CO2 emissions from • Field work, machinery • Production of fertilizers & pesticides “Food miles” thought to be relatively minor source • shifting <1 day/wk’s consumption of red meat to other protein sources or vegetable-based diet = same impact as buying local • GHG emissions dominated by production phase = 83% of average US household’s 8.1 tons CO2/yr footprint for food consumption (Gomiero et al. 2008, Niles et al. 2002, Weber & Matthews 2008)
Extreme Events* Change in Dry Periods and Hot Nights by 2100 (high emissions, “SRES A2”) NCDC 2011 Currently, NCDC estimates that the cost of the 2012 drought that affected much of the U.S. had an economic impact of $12B. This estimate was not reviewed or available prior to publication of this report, however, and may change. *Extreme events have been shown to be more probable than 40–50 years ago. However, one cannot attribute any single event to climate change alone.
Other solutions and adaptations Changing Demand • Switch from beef & dairyto other proteins, veggies (Weber & Matthews 2008, FAO 2003) Travel-eat-sleep.com news.bbc.co.uk
Agriculture and Climate Change • Agriculture has been and will continue to be significantly affected bychanges in climate conditions • Existing adaption strategies can help offset many – but not all –effects over the next 20-30 years; effects are very likely to worsen significantly beyond then, especially if GHG emissions remain high • Improving the resilience of agricultural systems to climate change requires protection of the natural resource base (water & soil) and development of new strategies, tools, and practices for adaptation For more information, please visit http://www.usda.gov/oce/climate_change/effects.htm
Some Discussion Questions: • Do developed nations have an obligation to reduce their consumption of beef? • Biofuels are one of the recommended mitigation strategies in the FAO report… but how does this interact with concerns over food supply? • Do you see improved land management practices being implemented in reality? Why/why not?
Acknowledgements & References Thanks to Alex Ruane for helpful suggestions Agriculture & the environment: Changing pressures, solutions, and trade-offs. In: World Agriculture: Towards 2015/2030 – An FAO Perspective. Ed. Bruinsma, J Climate change and agriculture: physical and human dimensions. 2003. In: World Agriculture: Towards 2015/2030 – An FAO Perspective. Ed. Bruinsma, J Easterling, W.E., et al. 2007: Food, fibre and forest products. Climate Change 2007: Impacts, Adaptation and Vulnerability. Contribution ofWorking Group II to the Fourth Assessment Report of the Intergovernmental Panel on Climate Change, M.L. Parry, O.F. Canziani, J.P. Palutikof, P.J. van der Linden and C.E. Hanson, Eds., Cambridge University Press, Cambridge, UK, 273-313 Gomiero, T., et al. 2008. Energy and Environmental Issues in Organic and Conventional Agriculture, Critical Reviews in Plant Sciences,27(4),239-254 Niles, J.O., et al. 2002. Potential carbon mitigation and income in developing countries from changes in use and management of agricultural and forest lands. Phil. Trans. R. Soc. Lond. A, 360:1621-1639. Patterson, D.T., et al. 1999. Weeds, insects, and diseases. Climatic Change, 43: 711-727. Weber, C., & Matthew, H.S. 2008. Food-miles and the relative climate impacts of food choices in the United States. Environmental Science & Technology, 42: 3508-3513. Charlie Walthall charlie.walthall@ars.usda.gov Jerry Hatfield jerry.hatfield@ars.usda.gov