Download

1 / 15
150 likes | 247 Views
Pan-Canadian Study of Reading Volumes. Andrew J. Coldman Diane Major Gregory Doyle Yulia D’yachkova Norm Phillips Jay Onysko Rene Shumak Norah Smith Nancy Wadden. Measuring Radiologist Skill. Factors thought to influence skill

E N D
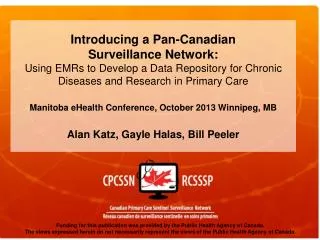
Pan-Canadian Study of Reading Volumes Andrew J. Coldman Diane Major Gregory Doyle Yulia D’yachkova Norm Phillips Jay Onysko Rene Shumak Norah Smith Nancy Wadden
Measuring Radiologist Skill • Factors thought to influence skill • training, specialization, screening setting, age (of radiologist), etc. • Volume of mammograms interpreted (usually on an annual basis) is included in • legislation in the United States (>480) • accreditation standards in Canada (>480) • NHS Breast Screening program standards in the United Kingdom (>5,000 annual) • Australian Breast Screening program (>2,000)
Pan-Canadian Study of Reading Volumes • To determine whether the current accreditation level (>480) in Canada was adequate or whether a higher requirement would result in superior outcomes. • A project was created in the QM committee to examine whether Canadian data could be analyzed to assist with answering this question. Objective: To determine the relationship between the annual screening volume and radiologists’ performance.
Provinces contributing to the national database were invited to participate. Dataset (1998–2000): • Radiologist ID, year of screen, indicator of 1st/subsequent screen and age of women at the time of screening, number of screening exams, number of abnormal screens, number of screen-detected cancers (both invasive and DCIS), number of post-screen cancers detected within 12 months of the last screen (both invasive and DCIS)
Participating Provinces • Data were obtained from seven provinces: British Columbia (BC), Alberta (AB), Manitoba (MB), Quebec (QC), Nova Scotia (NS), Newfoundland (NFL), and Ontario (ON).
Program start date and number of radiologists by province *Radiologists with an average of less than 480 screens per year within the program in the interval 1998-2000 were excluded.
Number of screen-detected cancers by age, screening sequence, and province in 1998-2000
Outcome Measures Used Cancer Detection Rate (CDR) = # screen detected cancers # screens Abnormal Call Rate (ACR) = # abnormal calls # screens Positive Predictive Value (PPV) = # screen detected cancers # abnormal calls
Method of analysis • Since all the outcomes are based on counts, we chose to use a Poisson Regression Model • The following covariates were included (to control for their effect): • Age (40–49, 50–59, 60–59, 70–79) • Screen sequence (first, subsequent) • Province • Radiologist reading volume (average annual) = (480–699; 700–999; 1,000–1,499; 1,500–1,999; 2,000–2,999; 3,000–4,999; 5000+) • Inter-radiologist variation, a random normally distributed factor reflecting individual radiologist performance
Poisson modelling for CDR—age, sequence, volume, and inter-radiologist variation * Measures median of the difference in performance between two rads chosen at random from the group.
Poisson modelling for ACR—age, sequence, volume, and inter-radiologist variation *Median difference in performance between two rads chosen at random from the group.
Poisson modelling for PPV—age, sequence, volume, and inter-radiologist variation *Median difference in performance between two rads chosen at random from the group .
Conclusions • No significant inter-provincial differences in any of the outcome measurements after control for the other factors. • Age and screen sequence significantly influenced all three outcomes, with age affecting cancer more and sequence affecting abnormal calls more. • The random differences between radiologists significantly affected all outcomes but affected the rate of abnormal calls more strongly than cancer detection. • Annual Screen Volume was significantly related to PPV only with increasing PPV up to 2,000 and then stability.