Download
1 / 32
320 likes | 576 Views
Chapter 10 – Undernutrition, and the Distribution of Income, Wealth, and Education. I. Economic development. A. Improvement in the standard of living of the entire population of a country B. Includes: 1. Raising annual per capita incomes.

E N D
Chapter 10 – Undernutrition, and the Distribution of Income, Wealth, and Education
I. Economic development A. Improvement in the standard of living of the entire population of a country B. Includes: 1. Raising annual per capita incomes
2. Eradication of absolute poverty (inability to provide basic necessities) 3. Reduction in inequality (gap between rich and poor)
C. Sustainable economic development 1. Economic development that meets the needs of the present without compromising the ability of future generations to meet their own needs 2. Economic development could come at the cost of environmental destruction
D. How is economic development measured? 1. Average per capita income a. BUT this measure tells us nothing about how income is distributed among the population
2. Caloric intake per capita 3. Infant mortality rate 4. Life expectancy
5. Number of doctors per 1,000 people in the country 6. Literacy rates 7. Years of schooling
8. Growth in the size of a nation’s economy a. Size of the economy is measured by GDP, GNP or GNI b. Growth is measured by change (rate of increase) in GDP
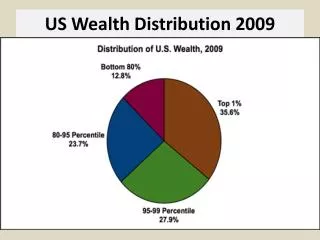
II. Distribution of income A. Worldwide income inequality 1. Richest 1/5 of the world’s people receives 82.7% of total world income 2. The poorest 5th receives 1.4% of total world income 3. Richest 2/5 get 94.4% 4. Everyone else gets 5.6%
82.7% of total world income richest 1/5 1/5 11.7% 1/5 2.3% 1/5 1.9% 1/5 poorest 1.4% world population distribution of income
B. Comparing countries 1. Richest 10 countries have < 10% of world population but produce > 60% of the world’s products 2. Poorest 56 countries have > 50% of world population but produce < 5% of the world’s products
3. Of the 15 countries that have the largest GNP of all countries: a. The U.S. has 4.6% of total world population and 31.1% of world total GNP b. China has 20.8% of total world population and 3.8% of world total GNP c. India has 17.8% of total world population and 1.5% of world total GNP
4. People in rich countries are more productive because they have: a. More and Better capital meaning better equipment at work c. Better roads and communications d. Better education
5. Exchange rate comparison a. Translates local currency into dollars at the going exchange rate b. Poorest country = Democratic Republic of the Congo with GNP per capita = $80
c. U.S. GNP per capita = $34,319 d. Switzerland is wealthiest country with GNP per capita = $38,330 e. Average income of the richest country is 500 times greater than that of the poorest
6. Purchasing power parity comparison a. Compares purchasing power of local currency to purchasing power of the dollar b. Poorest country = Ethiopia with GNP per capita = $450 c. Mozambique GNP per capita = $810
d. Switzerland GNP per capita = $25,860 e. U.S. is wealthiest country with GNP per capita = $26,980 f. Average income of the richest country is 50 times greater than that of the poorest
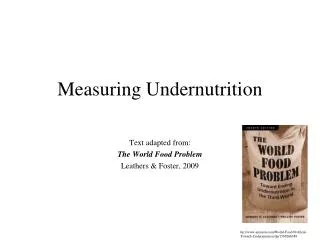
III. Income distribution & food consumption A. Reutlinger triangles (Figure 10.6-p.166) 1. Show calorie deficit among low-income people 2. Show overconsumption among the rich
B. A picture of the unequal purchasing power among different income groups
C. Income distribution is important in nutrition 1. The rich bid food away from the poor 2. The rich demand more livestock products a. Many livestock now fed grain (instead of grass or scraps) which could be eaten by the poor b. In 1984, 1/3 of the world’s grain went to feed livestock
D. Income redistribution that reduces the Reutlinger triangles will improve nutrition for both groups
E. How to redistribute income without losing incentives for food production? 1. Tax the rich & use money for programs for the poor?
2. Evidence shows that programs that emphasize health, fertility control, & education reduce income inequality, improve workers’ productivity, & increase the pace of economic development
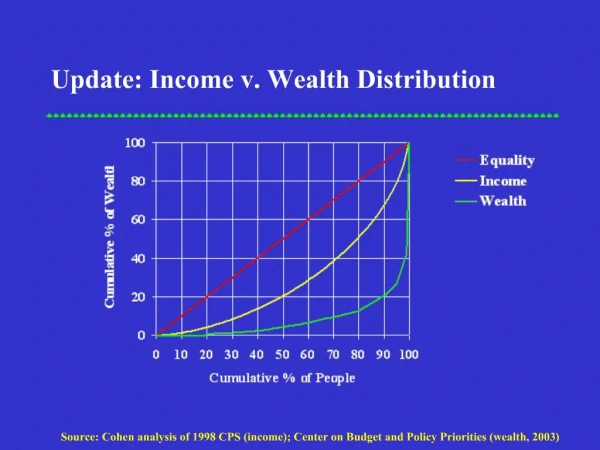
IV. Measuring income distribution within a country A. The Lorenz curve (Figure 10.3-p.154)
1. If income was equally distributed the Lorenz curve would be equal to the egalitarian line 2. The more the Lorenz curve bends away from the egalitarian line the greater the income inequality
V. What causes unequal income distribution? OR Why is A’s income greater than B’s? A. Ability - A is smarter than B B. Individual choice - A chose to work harder or take more risks than B C. Human capital - A got a better education than B
D. Family background - A came from a well-to-do, supportive family E. Segmented labor market - A works in the primary labor market (large firms & unions) and B works in the secondary labor market (small firms & no unions = lower wages)
F. Wealth inheritance - A inherited a large fortune from her parents
G. Discrimination - A is a white male and B is a black female H. Life cycle - A is in prime earning years and B is substantially younger or older I. Stochastic (random) - A is luckier than B