Download
1 / 9
90 likes | 231 Views
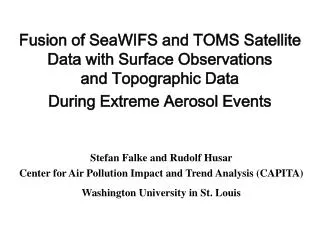
Fusion of SeaWIFS and TOMS Satellite Data with Surface Observations and Topographic Data During Extreme Aerosol Events. Stefan Falke and Rudolf Husar Center for Air Pollution Impact and Trend Analysis (CAPITA) Washington University in St. Louis. Overview.

E N D
Fusion of SeaWIFS and TOMS Satellite Data with Surface Observations and Topographic Data During Extreme Aerosol Events Stefan Falke and Rudolf Husar Center for Air Pollution Impact and Trend Analysis (CAPITA) Washington University in St. Louis
Overview Spaceborne sensors now allow near continuous aerosol monitoring throughout the world. When fused with surface data they can better describe the aerosol and provide a greater understanding of spatial, temporal, and chemical characteristics of the aerosol than can any single image or surface observation. We present the fusion of SeaWiFS and TOMS satellite data with surface observations and topographic data during four extreme aerosol events: • the April 1998 Asian dust storm that impacted the west coast of North America • the May 1998 Central American forest fire smoke that impacted eastern North America • the intense fall 1999 Northern California fires • the massive February 2000 Sahara dust storm
Satellite Data SeaWiFS • Spectral reflectance data from the SeaWiFS sensor provides a detailed spatial pattern of a swath of earth (~ 2800 km wide) at local noon each day (~ 1 km resolution) • A ‘true color” image was generated by combining the red (0.670 m), green (0.550 m), and blue (0.412 m) wavelengths. • Removed the scattering by air molecules from the total reflectance • Pixel radiance values were transformed to reflectance • The image was georeferenced using ENVI functions. TOMS • Retrievals of absorbing aerosol index from the TOMS satellite provided useful information on the daily (local noon) spatial distribution of dust and smoke covering a swath of approximately 3000 kilometers. • The TOMS absorbing aerosol signal is a semi-quantitative index of the columnar absorption by aerosols at 0.34 m. • The aerosol index is dependent on aerosol altitude so that higher aerosol indices are measured when aerosol exists at higher altitudes.
Surface Observations National Weather Surface (NWS) Visibility • over 200 airports across the U.S. • Meteorological processing/correction • Converted to extinction coefficient • Spatially interpolated Naval Research Laboratory (NRL) Visibility • a database of global synoptic surface weather reports • Qualitative observations of poor visibility • wind speed measurements
Other Data Topography • GTOPO30 is a global digital elevation model (DEM) with a spatial resolution of approximately 30 arc seconds (~ 1 km.). • The data were downloaded from the USGS EROS data center website: http:// • Transformed to 3D surface using ENVI Satellite Fire Observations • Defense Meteorological Satellite Program (DMSP) Operational Linescan System uses a light intensified visible wavelength channel to detect fires at night on a daily basis. • Fires are distinguished from the nighttime city lights by their transient behavior
1998 Asian Dust Storm The underlying color image is the surface reflectance derived from SeaWiFS. The TOMS absorbing aerosol index (level 2.0) is superimposed as green contours. The red contours represent the surface wind speed from the NRL surface observation data base. The blue circles are also from the NRL database and indicate locations where dust was observed. The high wind speeds generated the large dust front seen in the SeaWiFS, TOMS, and surface observation data.
1998 Central American Fires Smoke plumes over Central America appear over low elevation terrain, while high elevation regions remain mostly smoke free. SeaWiFS, TOMS, Visibility indicate high aerosol concentrations from Central America being transported over Central U.S.
1999 California Fires Fires on the eastern side of the San Joaquin Valley generate smoke dispersed to the west that is transported over the Pacific just north of San Francisco Smoke is dispersed at low elevations and is directed north-south by high elevation on western ridge of Valley
2000 Saharan Dust Fuerteventura and Lanzarote Islands are fully blanketed by the murky yellow colored dust plume. Gran Canaria and Tenerife are partly covered by the dust layer but their higher elevations appear to stick out above the dust layer at about 1200m Dust is transported off the west coast of Africa and across the Canary Islands.