Download
1 / 18
180 likes | 198 Views
Explore the factors affecting food costs & commodity prices, including crop yields, biofuels, global events & market trends. Understand the complex U.S. food marketing system & its impact on the economy.

E N D
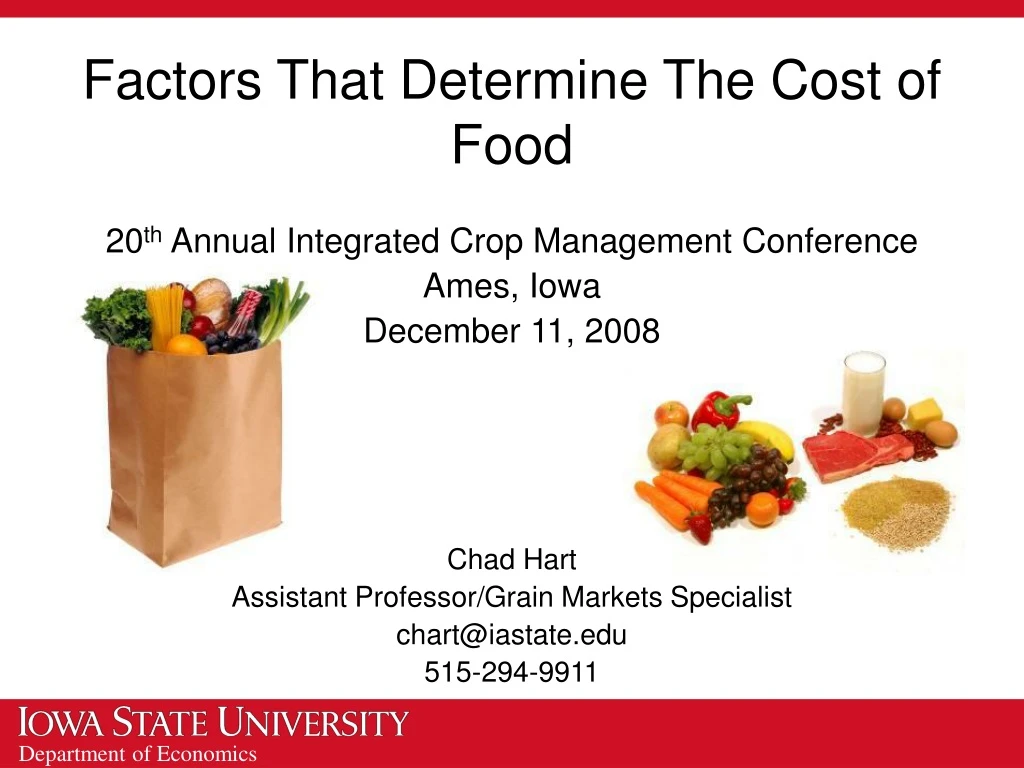
Factors That Determine The Cost of Food 20th Annual Integrated Crop Management Conference Ames, Iowa December 11, 2008 Chad Hart Assistant Professor/Grain Markets Specialist chart@iastate.edu 515-294-9911
Factors Leading to Higher Commodity Prices Source: USDA-ERS, Trostle, July 2008
Commodity Price Indexes Source: International Financial Statistics
Events in 2007 • Droughts: • Northern Europe, Ukraine, Russia, Northwest Africa, Turkey, Australia, and Argentina • Increased export taxes: • China, Argentina, Russia, Kazakhstan, Malaysia, and Indonesia • Export restrictions: • Argentina, Ukraine, India, Vietnam, Serbia, Egypt, Cambodia, Indonesia, and Kazakhstan
World Crop Production Rest-of-World Soybean Production Up 1076% Rest-of-World Corn Production Up 99% Rest-of-World Wheat Production Up 63% Source: USDA-PSD Database
Population Source: U.S. Bureau of the Census
Countries Pursuing Biofuels • US • Brazil • Argentina • Colombia • Paraguay • Canada • Uruguay • Mexico • Thailand • New Zealand • South Africa • South Korea • Philippines • Indonesia • Pakistan • China • India • Malaysia • Australia • Japan • EU • Russia • Not a complete list
Iowa’s Alternative Energy Sources Ethanol: 32 plants in operation 12 plants under construction Ranked 1st in ethanol production Biodiesel: 14 plants in operation 2 plants under construction Wind: Ranked 4th in wind energy production Ranked 1st in ratio of wind/total energy
Iowa’s Agricultural Rankings 1st: Corn Production Soybean Production Field Crop Value Egg Production Hog Inventory Hog Value on Farm Commercial Hog Slaughter Crop Harvested Area 2nd: Pig Crop Red Meat Production Total Crop Value 3rd: Number of Farms 4th: Net Farm Income Alfalfa Hay Production Steers – 500 Lbs. & Over 5th: Oat Production Cattle & Calves on Feed 6th: Heifers – 500 Lbs. & Over 7th: All Cattle & Calves 8th: All Hay Production All Sheep & Lambs 10th: Land in Farms Calf Crop Turkeys Raised Source: USDA-NASS
U.S. Food Marketing System • Five distinct sectors • Agricultural production • 2 million farms • Food processing and manufacturing • 25,000 food and beverage companies • Wholesale distribution • 33,000 food wholesalers • Retail distribution • 113,000 food retailers • 378,000 foodservice companies • Consumption • 111 million households
U.S. Food Marketing System In 2001, government estimates showed: 23.7 million employed in the food system 12% of the nation’s gross domestic product Food is a major component of our economy Each step in the system adds value and costs
The Food Dollar Source: USDA-ERS
Declining Farm Value in Food In the 1950s, 25% of food was consumed away from home. Today, nearly 50% of food is consumed away from home. Source: USDA-ERS
Farm to Retail Food Price Spread Source: USDA-ERS, 2001
Changes in Food Price Indexes 1BLS estimated expenditure shares, December 2007 2Forecasts updated November 21, 2008 Sources: Bureau of Labor Statistics, USDA-ERS
Quick Notes • Farm value is less than 20% of the food dollar. • Costs beyond the farm gate make up more than 80% of the food dollar. • Labor, transportation, energy, advertising, etc. • There have been a number of factors influencing food and commodity prices. • USDA Chief Economist Joe Glauber recently stated that biofuels are responsible for 10% of the inflation in food values.
Thank you for your time!Any questions?http://www.econ.iastate.edu/faculty/hart/