Download
1 / 18
180 likes | 316 Views
Hedrick Strickland Advised by Dr. Lynn Maguire and Matt Keene, US EPA. Convenience Analysis of the Oregon Paint Management Pilot Program. 64 million gallons (10%) of the architectural paint purchased in the US is left over

E N D
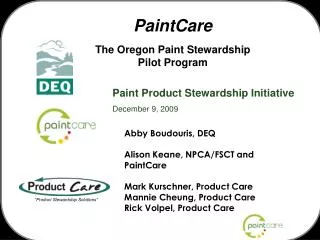
Hedrick Strickland Advised by Dr. Lynn Maguire and Matt Keene, US EPA Convenience Analysis of the Oregon Paint Management Pilot Program
64 million gallons (10%) of the architectural paint purchased in the US is left over largest component of household hazardous waste (HHW) collection programs half a billion dollars per year Background
Product Stewardship Institute (PSI) dialogue • 200 participants since December 2003 • reduce the generation of leftover paint • increase reuse and recycling opportunities • Oregon’s Paint Product Stewardship Law • passed summer of 2009, implemented July 2010 • first manufacturer-financed program for managing leftover architectural paint • Currently undergoing evaluation • 12 critical questions Background
Determine how convenient the drop-off locations are for Oregon residents based on • travel time to access a drop-off facility, • travel distance to access a drop-off facility • Statewide • Countywide • Develop a tool to aid in selection of potential locations Objective
Methods Locations active as of January 24, 2011 • Created service areas • 5, 10, and 15 miles • 5, 10, and 20 minutes • Estimated the population within each service areas
Methods -10 miles of roads -6 miles within the service area -Population = 200 SO: -120 people within service area
Site Selection and Convenience Analysis tool • Location-allocation process • My convenience analysis Methods
Time based service areas Population distribution Old population data Limitations
Recommended potential locations • single site • a specific number of sites • as many sites as are required to bring a given percentage of the population within a specified time or distance • Summary tables • statewide • county level Tool Outputs
High convenience statewide, lacking in some areas The most underserved residents include those living in Gilliam, Douglas, Polk, and Lincoln counties Site Selection and Convenience Analysis tool can help ensure that future programs achieve high convenience with limited facilities. Conclusions
Plan yearly collection event in Gilliam county Establish collection sites in Polk, Douglas, and Lincoln counties if funds become available If and when potential sites are chosen, use tool to select the most beneficial ones or to guide the order of activation. Recommendations
Lynn Maguire Matt Keene John Fay Lou Nadeau and others at ERG Thank You