Download
1 / 31
310 likes | 449 Views
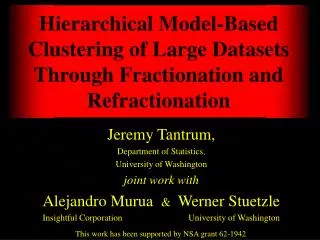
Hierarchical Model-Based Clustering of Large Datasets Through Fractionation and Refractionation. Jeremy Tantrum, Department of Statistics, University of Washington joint work with Alejandro Murua & Werner Stuetzle Insightful Corporation University of Washington.

E N D
Hierarchical Model-Based Clustering of Large Datasets Through Fractionation and Refractionation Jeremy Tantrum, Department of Statistics, University of Washington joint work with Alejandro Murua & Werner Stuetzle Insightful Corporation University of Washington This work has been supported by NSA grant 62-1942
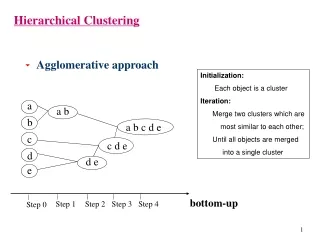
Motivating Example • Consider clustering documents • Topic Detection and Tracking corpus • 15,863 news stories for one year from Reuters and CNN • 25,000 unique words • Possibly many topics • Large numbers of observations • High dimensions • Many groups
Goal of Clustering Detect that there are 5 or 6 groups Assign Observations to groups
NonParametric Clustering • Premise: • Observations are sampled from a density p(x) • Groups correspond to modes of p(x)
NonParametric Clustering Fitting: Estimate p(x) nonparametrically and find significant modes of the estimate
Model Based Clustering • Premise: • Observations are sampled from a mixture density • p(x) = åpg pg(x) • Groups correspond to mixture components
Model Based Clustering Fitting: Estimate pg and parameters of pg(x)
Model Based Clustering Fitting a Mixture of Gaussians • Use the EM algorithm to maximize the log likelihood • Estimates the probabilities of each observation belonging to each group • Maximizes likelihood given these probabilites • Requires a good starting point
Model Based Clustering Hierarchical Clustering • Provides a good starting point for EM algorithm • Start with every point being it’s own cluster • Merge the two closest clusters • Measured by the decrease in likelihood when those two clusters are merged • Uses the Classification Likelihood – not the Mixture Likelihood • Algorithm is quadratic in the number of observations
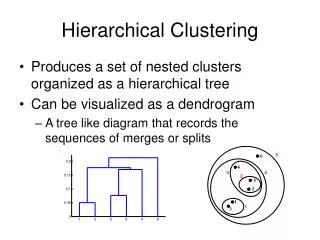
Likelihood Distance Merge gives small decrease in likelihood Merge gives big decrease in likelihood p(x) p1(x) p2(x) p(x) p1(x) p2(x)
Bayesian Information Criterion • Choose number of clusters by maximizing the Bayesian Information Criterion • r is the number of parameters • n is the number of observations • Log likelihood penalized for complexity
Fractionation Original Data – size n n/M fractions of size M Partition each fraction into aM clusters a < 1 an clusters If an >M (meta-obervations, mi) Invented by Cutting, Karger, Pederson and Tukey for nonparametric clustering of large datasets. M is the largest number of observations for which a hierarchical O(M2) algorithm is computationally feasible
Fractionation • an meta-observations after the first round • a2n meta-observations after the second round • ain meta-observations after the ith round • For the ith pass, we have ai-1n/M fractions taking O(M2) operations each • Total number of operations is: • Total running time is linear in n!
Model Based Fractionation • Use model based clustering • Meta-observations contain all sufficient statistics – (ni, mi, Si) • niis the number of observations – size • miis the mean – location • Siis the covariance matrix – shape and volume
Model Based Fractionation 10 meta-observations from the third fraction 10 meta-observations from the fourth fraction The 40 Meta-observations The Final Clusters Chosen by BIC Success! An example, 400 observations in 4 groups Observations in the first fraction 10 meta-observations from the first fraction 10 meta-observations from the second fraction
Example 2 The data – 400 observations in 25 groups Observations in fraction 1 10 meta-observations from the first fraction 10 meta-observations from the second fraction 10 meta-observations from the third fraction 10 meta-observations from the fourth fraction The 40 meta-observations The clusters chosen by BIC Fractionation fails!
Refractionation Problem: • If the number of meta-observations generated from a fraction is less than the number of groups in that fraction then two or more groups will be merged. • Once observations from two groups are merged they can never be split again. Solution: • Apply fractionation repeatedly. • Use meta-observations from the previous pass of fractionation to create “better” fractions.
Example 2 Continued The 40 meta-observations 4 new clusters 4 new fractions
Example 2 – Pass 2 Observations in the new fraction 1 Clusters from the first fraction Clusters from the second fraction Clusters from the third fraction Clusters from the fourth fraction The 40 meta-observations Clusters chosen by BIC
Example 2 – Pass 3 Clusters chosen by BIC Refractionation Succeeds The 40 meta-observations of pass 2 of fractionation 4 new clusters 4 new fractions Observations in the new fraction 1 Clusters from the first fraction Clusters from the second fraction Clusters from the third fraction Clusters from the fourth fraction The 40 meta-observations
Realistic Example • 1100 documents from the TDT corpus partitioned by people into 19 topics • Transformed into 50 dimensional space using Latent Semantic Indexing Projection of the data onto a plane – colors represent topics
Realistic Example Want to create a dataset with more observations and more groups Idea: Replace each group with a scaled and transformed version of the entire data set.
Realistic Example Want to create a dataset with more observations and more groups Idea: Replace each group with a scaled and transformed version of the entire data set.
Realistic Example To measure similarity of clusters to groups: Fowlkes-Mallows index • Geometric average of: • Probability of 2 randomly chosen observations from the same clusterbeing in the same group • Probability of 2 randomly chosen observations from the same group being in the same cluster • Fowlkes–Mallows index near 1 means clusters are good estimates of the groups • Clustering the 1100 documents gives a Fowlkes–Mallows index of 0.76 – our “gold standard”
Realistic Example • 19£19=361 clusters, 19£1100=20900 observations in 50 dimensions • Fraction size¼1000 with 100 metaobservations per fraction • 4 passes of fractionation choosing 361 clusters Number of fractions Distribution of the number of groups per fraction.
Realistic Example • 19£19=361 clusters, 19£1100=20900 observations in 50 dimensions • Fraction size¼1000 with 100 metaobservations per fraction • 4 passes of fractionation choosing 361 clusters • The sum of the number of groups represented in each cluster: • 361 is perfect
Realistic Example • 19£19=361 clusters, 19£1100=20900 observations in 50 dimensions • Fraction size¼1000 with 100 metaobservations per fraction • 4 passes of fractionation choosing 361 clusters Refractionation: • Purifies fractions • Successfully deals with the case where the number of groups is greater than aM, the number of meta-observations
Contributions • Model Based Fractionation • Extended fractionation idea to parametric setting • Incorporates information about size, shape and volume of clusters • Chooses number of clusters • Still linear in n • Model Based ReFractionation • Extended fractionation to handle larger number of groups
Extensions • Extend to 100,000s of observations – 1000s of groups • Currently the number of groups must be less than M • Extend to a more flexible class of models • With small groups in high dimensions, we need a more constrained model (fewer parameters) than the full covariance model • Mixture of Factor Analyzers
Fowlkes-Mallows Index Pr(2 documents in same group | they are in the same cluster) Pr(2 documents in same cluster | they are in the same group)