Download
1 / 28
430 likes | 1.82k Views
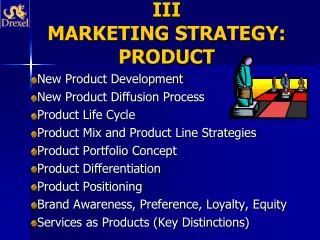
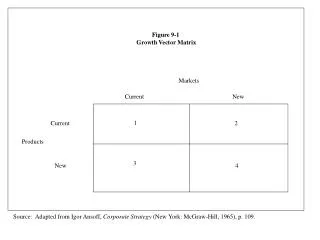
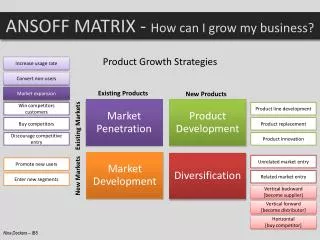
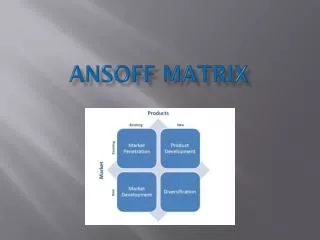
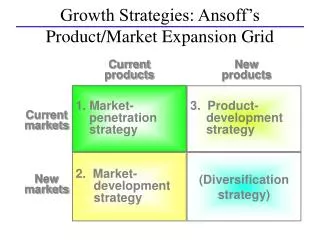
Growth Strategies: Ansoff’s Product/Market Expansion Grid. Current products. New products. 1. Market- penetration strategy. 3. Product- development strategy. Current markets. 2. Market- development strategy. (Diversification strategy). New markets. WHY FIRMS DIVERSIFY.

E N D
Growth Strategies: Ansoff’s Product/Market Expansion Grid Current products New products 1. Market- penetration strategy 3. Product- development strategy Current markets 2. Market- development strategy (Diversification strategy) New markets
WHY FIRMS DIVERSIFY • 1. A firm’s objectives can be no longer be met within the scope of the present business portfolio. • Market Saturation, General Decline in Demand, Competitive Pressure on Product line, or Obsolescence may reduce immediate or long term profitability. A typical symptom would be a drop in the rate of return on reinvestments. • 2. Even if attractive expansion opportunities are still available and past objectives are being met, a firm may diversify because the retained cash exceeds the total expansion needs of the present portfolio. • 3. Even if current objectives are being met, a firm may diversify when diversification opportunities promise greater profitability than expansion opportunities. • When diversification opportunities are sufficiently attractive to offset their inherently lower synergy. • When firm’s R&D produces outstanding diversification by-products. • When Synergy is not considered important by firms and Synergy advantages of expansion over diversification are not considered important. This is typically the case in conglomerate firms.
4. Firms may suffer from the ‘grass is greener on the other side’ syndrome. • Lacking reliable information about diversification alternatives, such firms tend to plunge rather than probe diversification alternatives. A much less costly approach is to buy reliable information before plunging.
LEVELS OF DIVERSIFICATION • Low Levels of Diversification • Single Business:More than 95% of revenue comes from a single business • Dominant Business: Between 70% to 95% of revenue comes from a single business • Moderate to High Levels of Diversification • Related Constrained: Less than 70 % revenues come from the dominant business. All businesses share product, technological and market linkages. • Related Linked (mixed related and unrelated): Less than 70 % revenues come from the dominant business. There are only limited links between the businesses. • Very High Levels of Diversification • Unrelated: Less than 70 % revenues come from the dominant business. There are no links between businesses.
FUNDAMENTAL ROLE OF DIVERSIFICATION The fundamental role of diversification is for Corporate Managers to create value for stockholders in ways that stockholders cannot do better for themselves.
DIVERSIFICATION: A CORPORATE STRATEGY Diversification: The fundamental role of diversification is for Corporate Managers to create value for stockholders in ways stockholders cannot do for themselves. Forms of Diversification Vertical Horizontal Global Acquisition Strategic Alliances Internal Growth
VALUE CREATION THROUGH DIVERSIFICATION (ACQUISITION) Figures in Rs. Crores except price per share
VALUE CREATION THROUGH DIVERSIFICATION (ACQUISITION) • Economic Gain (Increased Earnings) of the Acquisition = Rs. 4 Crores • Assuming that • It is a permanent gain. It is a perpetuity. • The cost of capital is = 20 % • Then, Present Value of Economic Gain is = Rs.4/.2 Crores • = Rs. 20 Crores Total Market Value of the Firms: (Say, company A paid Rs. 47.5 Crores to acquire Company B) Market Value of Co. A (Before Acquisition) = Rs.480 Crores Market Value of Co. B = Rs. 40 Crores Present Value of Gains = Rs. 20 Crores Cash paid to acquire = Rs. 47.5 Crores Post Merger Market Value = Rs.492.5 Crores
VALUE CREATION THROUGH DIVERSIFICATION (ACQUISITION) Figures in Rs. Crores except Price per Share
COST AND BENEFIT SHARING BETWEEN THE COMPANIES • First Case: All cash Deal • Benefits to the Shareholders of Company B • Gains = Receipts - Market Value • = Rs. 47.5 Crores - Rs. 40 Crores • = Rs. 7.5 Crores • Benefits for the shareholders of Company A • Gains = Market Value Post merger - Market Value Pre Merger = Rs 492.5 Crores - Rs. 480 Crores • = Rs 12.5 Crores • Total Economic Gain = Rs 20 Crores.
BENEFIT SHARING BETWEEN STOCKHOLDERS OF THE COMPANIES • Second Case: Acquisition financed by stock. • Company A has issued 1 share to stockholders of Co. B for every 3 shares held by them. • Number of Additional Shares issued = 2.5 Crores/3 = 83,33,333 • Value of shares of Co. B = Rs 49.85 * 83,33,333 • = Rs 41.5 Crores • Gains Captured by Shareholders of Co. B = Rs 41.5 Crores - Rs. 40 Crores • = Rs 1.5 Crores • Gains of Shareholders of Co. A = Economic Gain - Cost • = Rs. 20 Crores - Rs. 1.5 Crores • = Rs. 18.5 Crores.
VERTICAL INTEGRATION • Benefits: • Building Barriers to Entry. • Reduced Transaction Costs. • Note: Tapered Integration. • Limits: • MES • Responsibility for Technology Up-gradation and Innovation in all businesses. • Integration of Cultures • Questions for Deciding when to Vertically Integrate: • Are our existing suppliers or Customers meeting the Consumers needs? • Can you “own” the business without really buying it? • Is it giving any structural advantage? How volatile is the competitive environment
HORIZONTAL DIVERSIFICATION • Horizontal Diversification entails moving into more than one industry. It can be • Related Diversification • Unrelated Diversification or Conglomerate Diversification • The case for Conglomerates • Corporate managers have capability to spot low valued stocks. • Corporations may be able to borrow money at Lower interest rates and pay lower per share brokerage. • The case against Conglomerates • Conglomerate discounts. Resulting in Corporate Raiders. • Takeover Premiums.
Discounting worldwide competition represents a serious mistake for several reasons: • Research has shown that early entrants into a new internationalised market not only gain greater market shares but also outlast the late entrants. This implies that the firms should not only enter the international scene but should attempt to get there early. • The trend towards worldwide market makes it difficult to predict where the competition may spring from. The case of TCS, Mumbai becoming a serious competitor in the world software programming industry. • Foreign investments would keep growing as foreign firms buy up domestic businesses. • The greatest growth opportunities exist overseas in developed and developing nations. For instance, the European Union of twelve countries now represents the largest market in the world. Countries such as China, Mexico are economies growing at a faster pace than others. These could be markets of opportunities.
Advantages of Global Diversification: • Locational Economies. • Achieve economies of scale through greater volumes using international sales opportunities. • To compete effectively in domestic markets, the corporations must be willing to fight the international players in their home turf. Case of Michelin tyres and Fuji Xerox.
EVALUATING REASONS TO DIVERSIFY Least Power to Create Value Most Power to Create Value Maintaining Growth Balancing Cash Flow Sharing Infrastructure Increasing Market Power Capitalizing on Core Competence Reducing Risk Not recommended as Reason to Diversify Recommended as Reason to Diversify
BOSTON CONSULTING GROUP GROWTH SHARE MATRIX A Typical Product Portfolio Chart of a Comparatively strong and diversified company PRODUCT SALES 20%- 18%- 16%- 14%- 12%- 10%- 8%- 6%- 4%- 2%- 0 ? ? Market growth rate 10x 4x 2x 1.5x 1x .5x .4x .3x .2x .1x Relative market share
BOSTON CONSULTING GROUP GROWTH-SHARE MATRIX ? Modest + or - Cash Flow Large Negative Cash Flow HIGH ? CASH USE (Growth Rate) Optimum Cash Flow Modest + or - Cash Flow LOW Large Positive Cash Flow HIGH LOW CASH GENERATION (Market Share)
BOSTON CONSULTING GROUP GROWTH SHARE MATRIX SUCCESS SEQUENCE 20%- 18%- 16%- 14%- 12%- 10%- 8%- 6%- 4%- 2%- 0 ? ? Market growth rate 10x 4x 2x 1.5x 1x .5x .4x .3x .2x .1x Relative market share
BOSTON CONSULTING GROUP GROWTH SHARE MATRIX DISASTER SEQUENCE 20%- 18%- 16%- 14%- 12%- 10%- 8%- 6%- 4%- 2%- 0 ? ? Market growth rate 10x 4x 2x 1.5x 1x .5x .4x .3x .2x .1x Relative market share
Strategy for Cash Cows: The goal is to do just enough to DEFEND a cash cow’s market position so it can efficiently generate cash to reallocate to business investments elsewhere! BOSTON CONSULTING GROUP GROWTH SHARE MATRIX
Strategy for Dogs: Harvest Divest or spin off Liquidate or close down BOSTON CONSULTING GROUP GROWTH SHARE MATRIX
Strategy for Stars: Offer excellent profit & growth opportunities Vary as to whether they are Self-sustaining or Require infusions of investment funds from corporate parent BOSTON CONSULTING GROUP GROWTH SHARE MATRIX
Strategy for Question Marks or Problem Child: Rapid industry market growth makes businesses attractive, but low relative share positions raise questions about future potential. Cash needs are high & internal cash generation is low, making them cash hogs. BOSTONCONSULTING GROUP GROWTH SHARE MATRIX
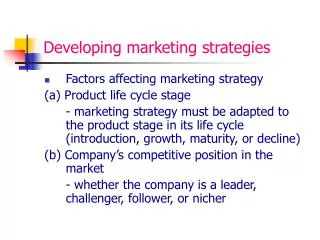
Market Life Cycle Competitive Strength Matrix Introduction Growth Maturity Decline Push High Competitive Strength Caution Medium Danger Low
Strong Average Weak High Medium Low General Electric’s Industry Attractiveness-Business Strength Matrix Business Strength • Market Share • Core Competencies • Profit Margin vs Competitors • Ability to Match Price/Service • Relative Costs • Knowledge • Technological Ability • Management Caliber Industry Attractiveness • Market Size • Growth Rate • Profit Margin • Competition Intensity • Seasonality • Cyclicality • Technology & Capital • Social Impact • Regulation • Environment • Opportunities & Threats • Barriers to Exit/Entry
TRANSACTION COSTS AS A BASIS FOR DIVERSIFICATION HIGH COST OF TRANSACTIONS COSTS OF FINDING BUYERS AND SELLERS FEAR OF OPPORTUNISM COSTLY TO WRITE A CONTRACT COSTLY TO ENFORCE A CONTRACT ASYMMETRIC INFORMATION BETWEEN BUYERS AND SELLERS LONG TERM CONTRACT UNDER DYNAMIC CONDITIONS RELATIONSHIP SPECIFIC INVESTMENTS UNCLEAR PROPERTY RIGHTS
CONGLOMERATES AS ALTERNATIVE TO MARKETS DEVELOPED DEVELOPING • Equity focused • Monitoring • by disclosure rules • Market for corporate control Under-developed weak equity market & Nationalized Banks Weak Monitoring CAPITAL MARKET PRODUCT MARKET FACTOR MARKET FIRM DEVELOPED DEVELOPING CONTRACT ENFORCEMENT DEVELOPED DEVELOPING Many B Schools and Consulting firms offering talent Certified skills enhancing mobility Few of these Reliable enforcement of liability laws Efficient dissemination of Information Activist Consumers Limited enforcement of liability laws Little dissemination of Information Few Activist Consumers DEVELOPED DEVELOPING Predictable Unpredictable GOVT REGULATIONS Low. Relatively free of Corruption Not So