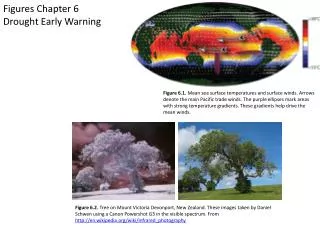

FIGURES FOR CHAPTER 6
E N D
Presentation Transcript
MATTERS OF FUNCTIONAL FORM FIGURES FORCHAPTER 6 Click the mouse or use the arrow keys to move to the next page. Use the ESC key to exit this chapter.
Figure 6.3The constant growth model in discrete time(Y0 = 100, g = 0.05).
Figure 6.6Prices during the Hungarian hyperinflation of 1945–1946.
Figure 6.8Prais and Houthakker’s Engel curve for meat consumption, based on a lin-log regression model.
Figure 6.10Prais and Houthakker’s Engel curve for meat consumption, based on a reciprocal regression model.
Figure 6.12Alternative functional forms for an Engel curve fitted to Houthakker’s electricity demand data.
Figure 6.13Money and prices during the Germanhyperinflation,September 1920– November 1923 (Sept. 1920 = 1.0).
Figure 6.14Money and pricesduring the Polishhyperinflation, April 1922– November 1923 (April 1922 = 1.0).
Figure 6.15The velocity of money in the United States, 1869–1970.
Figure 6.16Real money holdings log(Mt/Pt ) decline during a hyperinflation.