Download
1 / 15
160 likes | 687 Views
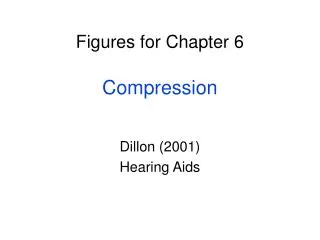
Figures for Chapter 6 Compression. Dillon (2001) Hearing Aids. Varieties of compression. High Level. Wide Dynamic Range. Low Level. Weak. Weak. Intense. Weak. Intense. Intense. Moderate. Moderate. Moderate. Input level.

E N D
Figures for Chapter 6Compression Dillon (2001) Hearing Aids
Varieties of compression High Level Wide Dynamic Range Low Level Weak Weak Intense Weak Intense Intense Moderate Moderate Moderate Input level Figure 6.1 Three ways in which the dynamic range of signals can be reduced. In each case, the upper figure shows the spacing of different signal levels before amplification (the left end of the lines) and after amplification (the right end of the lines). The lower figure shows the same data, but as an input-output function. Source: Dillon (2001): Hearing Aids
Compression waveforms Output: Pressure Input: Time Figure 6.2 Waveforms that are input to a compressor and output from a compressor, showing the attack and release transitions that follow an increase and decrease, respectively, in signal level. The dotted line shows the envelope of the positive half of the signal. Source: Dillon (2001): Hearing Aids
Ts Linear Slow Ta= Tr = 10Ts Medium Ta = Tr = Ts Fast Ta = 0.1Ts Tr = 0.3 Ts Compressed envelopes Figure 6.3 Envelopes for the output signal coming from a linear amplifier and compression amplifiers with different attack times (Ta), and release times (Tr) compared to the duration of each syllable (Ts) in the signal. Source: Dillon (2001): Hearing Aids
Feedforward compression Delay Detector Figure 6.4 A block diagram of a feedforward, look-ahead compression control circuit. Source: Dillon (2001): Hearing Aids
I-O curve and gain-input curve Figure 6.5 Upper: input-output diagram showing the definition of several static compression characteristics. Lower: the graph of gain versus input that corresponds to the I-O curve above it. Source: Dillon (2001): Hearing Aids
Cuvilinear compression Figure 6.6 Input-output characteristics corr-esponding to curvilinear compression(solid line) and a fixed compression ratio combined with compression limiting (dashed line). Source: Dillon (2001): Hearing Aids
Output (dB SPL) Vol max 100 90 80 70 Input (dB SPL) 60 50 Vol min 40 40 50 60 70 80 90 100 110 Vol max F 100 Output (dB SPL) 90 80 70 Vol min 60 Output controlled compression 50 40 40 50 60 70 80 90 100 110 Input (dB SPL) F Input controlled compression Figure 6.7 Input controlled compression and output controlled compression: their block diagrams and the I-O curves for each as the volume control is varied from maximum to minimum positions. Source: Dillon (2001): Hearing Aids
Linear and compressed envelopes Figure 6.8 (a) Envelope of the signal The yellow flower has a big bud put into the hearing aid at two levels. The thick curve shows the envelope for linear amplification and the thin red curve shows the envelope for a compressor with a 3:1 compression ratio, attack time of 20 ms, and release time of 200 ms. Part (b) shows the gain applied by the compressor. Part (c) shows the envelope for linear amplification and for compression when the attack and release times of the compressor were increased to 1000 and 2000 ms respectively. The corresponding gain is shown in part (d). Source: Dillon (2001): Hearing Aids
Figure 6.9 Input-output curves for medium level compression, wide dynamic range compression, and linear amplification, all combined with either compression limiting or peak clipping of high level signals. Source: Dillon (2001): Hearing Aids
Loudness normalization Figure 6.10 (a) Loudness growth curves for normal hearing people and a hearing impaired person with a 50 dB hearing loss. (b) Insertion gain needed for the impaired listener to receive a normal loudness sensation. (c) The corresponding I-O curve. Source: Dillon (2001): Hearing Aids
(b) + (c) 50 Gain (dB) 90 0.1 0.2 0.5 1.0 2.0 5.0 Frequency (kHz) Loudness normalization (TILL) (a) Figure 6.11 Block diagrams of (a) two-channel and (b) single channel processing schemes that can implement approximations of loudness normalisation, and (c) the resulting typical TILL gain-frequency response that increases in slope as the input level decreases from 90 to 50 dB SPL. Source: Dillon (2001): Hearing Aids
Possible masking Input Spectral Level (a) Signal Noise (b) Gain Noise (c) Signal Output Spectral Level 1 kHz Frequency Noise reduction Figure 6.12 (a) Spectrum of the signal and noise input to a noise reduction hearing aid. (b) Gain applied to the signal and noise. (c) Spectrum of the signal and noise at the hearing aid output. Source: Dillon (2001): Hearing Aids
+ Noise reduction (BILL) Figure 6.13 Block diagrams of two-channel and single-channel processing schemes that can implement simple noise reduction strategies, and the resulting BILL response that decreases in slope as the input level decreases from 90 to 50 dB SPL. 0.2 0.1 0.5 1.0 2.0 5.0 Frequency (kHz) Source: Dillon (2001): Hearing Aids
Output levels Output range Input Range Linear Compression Output level 70 Input level Figure 6.14 Input-output functions for two different hearing aids adjusted to have the same output for a 70 dB SPL input signal. Source: Dillon (2001): Hearing Aids