Download
1 / 22
320 likes | 643 Views
Point Sampling Inventories Concept Measuring Basal Area. FOR 274: Forest Measurements and Inventory. Point Sampling Inventories: Concept. In point inventories, trees are sampled based on their size and not by how often they occur.

E N D
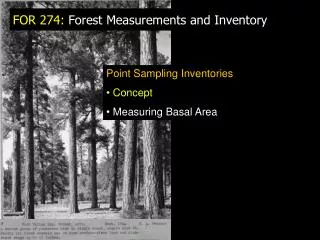
Point Sampling Inventories • Concept • Measuring Basal Area FOR 274: Forest Measurements and Inventory
Point Sampling Inventories: Concept In point inventories, trees are sampled based on their size and not by how often they occur. Points are located as part of a cruise and a fixed angle tool is used to look at the tree’s DBH to determine whether a tree is in or out of the plot. • Notes: • - The smaller the angle, more stems will be included • Larger trees are more likely to be included in the cruise • No need to set up plot corners: fast cruising method
Point Sampling Inventories: Concept In fixed area plots it was easy to scale the plot measure to an acre measure i.e. multiply the values by the reciprocal of the plot size: e.g., For 10th acre plot: trees in plot x 10 = trees per acre In point sampling, this multiplication factor is dependent on the size of the trees being sampled. This multiplication (or expansion factor) is called the Basal Area Factor (BAF), where # of trees X BAF = BA per acre.
Point Sampling Inventories: Concept Therefore, each tree selected for measurement represents *TF* trees per units area: hence “Tree Factor” For this 1/10th acre square plot each measured tree “represents” 10 trees per acre.
Point Sampling Inventories: Concept • This approach is described by lots of names: • Angle-count sampling • Probability proportional to size (PPS) • Bitterlich method • Plotless cruising • Prism cruising • Variable-plot cruising • Variable-radius plot cruising • Point sampling • Horizontal point sampling
Point Sampling Inventories: Application Step 1. Select an angle The selection of the angle is based on experience of the tree sizes and distribution in the stand, but the aim is such that ideally 5-12 trees will be tallied at each point. Examples of what you may use: BAF 5: low density pole stands BAF 10: high density pole stands BAF 20: large, old growth saw timber BAF 40: pacific Douglas fir
Point Sampling Inventories: Application Plot radius is proportional to tree diameter: For trees right at edge the diameter / plot radius = a constant, k From some math: BAF = 10890*(D2/R2) And from some trig: D/R = 2 sin (θ/2)
BAF: Calculating BAF from an angle For an object of fixed width, held a fixed distance away from your eye you can work out the angle θ: Thumb: 2/3 “ held at 24” away θ = tan -1 (half width / distance) = 0.3333/24 θ = 0.79° k = 2 sin (θ/2) = 0.014 BAF = 10,890 k2 = 2.13 Therefore your thumb “represents 2.13 units of basal area for each tree measured”
Point Sampling Inventories: Application Step 2. Plot Radius Factor To calculate whether a tree will be IN we think about the D/R ratio as a triangle. DBH R = Distance from tree to point A 1” DBH tree measured with a 10 BAF will be IN if its within 33 inches of the point. A 12” DBH tree measured with a 10 BAF will be IN if its within (12*33) = 396” = 33 ft of the point.
Point Sampling Inventories: Application Step 2. Plot Radius Factor The Plot Radius Factor (PRF) allows us to calculate for a given BAF the maximum distance (or limiting distance) that a tree can be from the point to be IN. DBH (inches) x PRF = Maximum Distance from Point (feet)
Point Sampling Inventories: Application Another way to work this out when using non-standard BAFs is: BAF = 10,890 (D/R)2 So for BAF = 28 (D/R) = 0.0507 We can work out the maximum (or limiting) distance a tree can be at to be in the plot R = D/0.0507 For example a 10” tree will be “in” if within: R = 10/0.0507 = 197” = 16.4 feet
Thinking About Measurements: Basal Area • Prisms • Most commonly used sighting angle gauge • Relatively inexpensive • “Built-in” method for correcting for slope • Infinite number of BAFs available. • Offsets the viewed image slightly
Thinking About Measurements: Basal Area • Trees is counted if its image overlaps the image seen above and below the prism • Borderline trees • Trees not counted if image does not overlap
Thinking About Measurements: Basal Area Prisms and Slope:
Select BA Factor (5, 10, 20, 40) to ensure tally of 5-12 trees • Center eye over Plot Center • Hold chain ‘like an archer’ and aim the gauge at the target trees’ breast height • Circle around plot center and aim gauge at tree’s DBH • If tree DBH > Angle Gauge Width ADD to tally • BA/unit area = BAF * Tally Basal Area: The Angle Gauge