Digital Image Processing Chapter 4
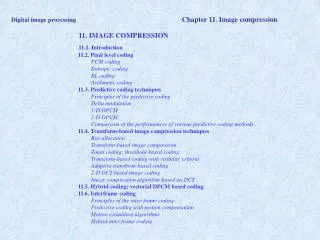
Digital Image Processing Chapter 4. Image Enhancement in the Frequency Domain Part I. Background. The Analytic Theory of Heat, 1822, Jean Baptiste Joseph Fourier

Digital Image Processing Chapter 4
E N D
Presentation Transcript
Digital Image ProcessingChapter 4 Image Enhancement in the Frequency Domain Part I
Background • The Analytic Theory of Heat, 1822, Jean Baptiste Joseph Fourier • Any function that periodically repeats itself can be expressed as the sum of sines and/or cosines of different frequencies, each multiplied by a different coefficient (Fourier Series) • Even non periodic functions can be expressed as the integral of sines and/or cosines multiplied by a weighting function (Fourier Transform) • The important characteristic that a function, expressed in either a Fourier series or transform, can be reconstructed (recovered) completely via an inverse process, with no loss of information.
Background • Fourier series • Periodic Signals can be expressed as the sum of sines &/or cosines of different frequency. • The Fourier series representation of a real-valued periodic signal f(t) can be written in complex exponential form as • Where the Fourier series coefficients are given by • And the fundamental frequency is , where is the period. • The complex exponential form of the Fourier series can be rewritten in trigonometric form as
Background • Where the coefficients are given by
Fourier Transform • The Fourier transform of a continuous function f(x) and its inverse Fourier transform • Functions of two variables • We call them Fourier transform pair
Discrete Fourier Transform • The Fourier transform of a discrete function f(x), x=0,1,2,…,M-1 is given by (Discrete Fourier transform, DFT) • inverse DFT • The multiplier 1/M in front of the Fourier transform sometimes is placed in front of the inverse instead • Or, both equations are multiplied by
Discrete Fourier Transform • Euler’s formula • DFT is represented as • Each term of the Fourier transform is composed of the sum of all values fo the function f(x). The values of f(x) are multiplied by sines and cosines of various frequencies • The domain (values of u) of F(u) is appropriately called frequency domain because u determines the frequency of the components of the transform
Discrete Fourier Transform • The Fourier transform may be viewed as a “mathematical prism” that separates a function into various components based on frequency content • In the analysis of complex numbers, it is convinient to express F(u) in polar coordinates • where
Discrete Fourier Transform • M=1024, A=1, K=8 or 16 • The important features to note are that • the height of the spectrum doubled as the area under the curve in the x-domain doubled, • the number of zeros in the spectrum in the same interval doubled as the length of the function doubled
2DDFT and Inverse DFT (IDFT) f(x, y) F(u, v) M, N: image size often used short notation: x, y: image pixel position u, v: spatial frequency
Real Part, Imaginary Part, Magnitude, Phase, Spectrum Real part: Imaginary part: Magnitude-phase representation: Magnitude (spectrum): Phase (spectrum): Power Spectrum:
2D Discrete Fourier Transform • The relationships between samples in the spatial and frequency domains
Frequency Domain Properties • Each term of F(u,v) contains all values of f(x,y), modified by the values of exp. • It is usually impossible to make direct association between specific components of the image and it transform. • The Fourier spectrum shows prominent components along the ±45º directions that correspond to the edges • Vertical component that is off-axis slightly to the left is caused by the edges of the oxide protrusions
2D DFT Properties Mean of image/ DC component: Highest frequency component: “Half-shifted” Image: Conjugate Symmetry: Magnitude Symmetry:
2D DFT Properties Spatial domain differentiation: Frequency domain differentiation: Distribution law: Laplacian: Spatial domain Periodicity: Frequency domain periodicity:
1 1 1 1 1 1 1 1 · · · · · · N - 1 1-N 2 -1 -2 W W · · · · · · W W W W 1 1 N N N N N N · · · · · · · · · · · · · · · · · · · · · · · · 2 (N-1) 2 N - 1 2(N-1) 1-N 2(1-N) - (N-1) W W · · · · · · W W W W 1 1 N N N N N N Computation of 2D-DFT Fourier transform matrices: remember relationship: In particular, for N = 4:
Computation of 2D-DFT • To compute the 1D-DFT of a 1D signal x (as a vector): To compute the inverse 1D-DFT: • To compute the 2D-DFT of an image X (as a matrix): To compute the inverse 2D-DFT:
Computation of 2D-DFT: Example • A 4x4 image • Compute its 2D-DFT: MATLAB function: fft2 lowest frequency component highest frequency component
Computation of 2D-DFT: Example Real part: Imaginary part: Magnitude: Phase:
Computation of 2D-DFT: Example • Compute the inverse 2D-DFT: MATLAB function: ifft2
Centered Representation MATLAB function: fftshift From Prof. Al Bovik Example: From [Gonzalez & Woods]
Log-Magnitude Visualization 2D-DFT centered
Apply to Images 2D-DFT centered log intensity transformation