Download
1 / 40
400 likes | 493 Views
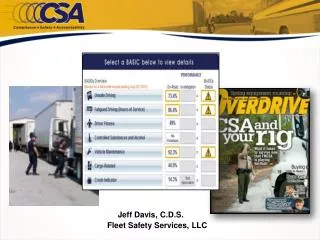
Jeff Davis, C.D.S. Fleet Safety Services, LLC. Anonymous Polling Question #1 1. Does your Company currently have any “deficient” or “monitored” CSA BASIC’s? Yes No 3. I do not know. Anonymous Polling Question #2 1.

E N D
Jeff Davis, C.D.S. Fleet Safety Services, LLC
Anonymous Polling Question #1 1 • Does your Company currently have any “deficient” or “monitored” CSA BASIC’s? • Yes • No • 3. I do not know
Anonymous Polling Question #2 1 • Has your Company received either a “focused” or “full” intervention by the FMCSA due to your CSA scores? • Yes • No • 3. I do not know
The Theory of CSA Results In Safe Behavior Safety Event Compliance Less Crashes Intervention Safety Event Non-Compliance Results In At- Risk Behavior More Crashes
The Purpose of CSA Carrier Safety Rating *Proposed* Driver Safety Rating *Enforcement* Every 30 Days Continue to Operate Pass Compass Marginal Inspect with Caution Unfit Inspect In Detail
The Inspection Results of CSA Only 45,599 motor carriers have 20 or more roadside inspections
Speed Warnings Form & Manner Medical in Possession Limited Data Clearance Lights Securement All Crashes The Most Predominant Violations of CSA Dominant Violation
Most Frequent CSA Driver Violations 2012- Fiscal YTD Fatigue Fatigue Fitness Fitness Fatigue
Most Frequent CSA Observable Defects 2012- Fiscal YTD Visual Inspection
CSA Fatigue Driving Analysis 2012- Fiscal YTD 392.3- Operating while ill or fatigued. (.01%) top Source: CSA Top Driver Violations
Fatigue Driving Violations 2012- Fiscal Year to Date 392.3- Operating while ill or fatigued 70%
How to Control Fatigue Driving Random 4% Observable Defects 32% ISS-D 32% Speed 32%
Most Frequent Unsafe Driving Violations Causing Fatigue Violations
Pre-CSA M.P.H Over the Posted Speed Limit 1 M.P.H. Over Come and Inspect me! 6 to10 Over Express I defy you to inspect me! CSA Tiered Speed Enforcements 1 to 5 1 6 to 10 4 11 to 14 7 > 15 10
The Aggregate Speed Warnings of CSA P P P P P P P P P P P Source: FMCSA-MCMIS
8.52% of fleet mileage 48% of Unsafe Pts.
Speed Induced Inspections by State Year 2011 Source: FMCSA-MCMIS
The “Tiered” Speeding Warnings of CSA Indiana vs. National Totals 2011 Source: FMCSA-MCMIS
Carriers with Serious Violations High Risk Carriers Carriers with 2 or 3 Monitored BASIC’s Carriers with a Monitored Fatigue BASIC 1 The BASIC’s Determine the ISS Number 2 3 4 Inspect 75-100 Unsafe or Crash Monitored BASIC Single Alert BASIC: Cargo, Controlled Substances, Driver Fitness or Vehicle 1 2 Optional 50-74 Pass 1-49 No Monitored BASIC’s with sufficient data to Measure* 25
Determines the ISS Determines the BASIC’s The Inspection Selection Cycle Driver Performance Initiates Interventions
32652 ISS on the Roadside 75-100 Inspect 50-74 1-49
High-Risk Motor Carriers Any 4 or more monitored BASICs Crash OR Fatigue OR Unsafe ≥ 85 PLUS 1 other monitored BASIC Mandatory CR High Risk for two consecutive months AND No Full or Focused CR with 24 months
88% Driver Controllable Inspections Root Cause Analysis Why? Why? Why?
Analyzing CSA Data Total CSA Points Total BASIC Points Points by Dominate Violations Who? Who? Drivers Equipment
Analyze the Performance Data Monitor Performance Analyze Monitor Safety Event Data G.P.S. E.C.M. M.V.R. Roadside Observations Train Develop a list of “Targeted Drivers” by: Type of Violation Top Offenders Location of Violations Root Cause Monitor Increase Severity of Control and Discipline as warranted by Driver Performance Top Point Accumulator Form & Manner The Driver Accountability Process Train Targeted Drivers Initiate an individual Driver Control Program Training, Control & Consequences
Moving From What To Why InThe Safety Management Cycle What Safety Management processes are failing? Why are Safety Management processes are failing?
The Safety Management Cycle Requirements Policies Procedures Company Leadership Defined Responsibilities Administrative Resources Requires Roles Responsibilities Qualification Hiring Analysis of Driver Safety Data and Driver Interaction Requires Training Communication Monitoring Tracking Meaningful Implementation of Established Accountability Processes Requires Meaningful Action
Unsafe Driving-The Safety Management Cycle Meaningful Action Policies Procedures Roles Responsibilities Qualification Hiring Training Communication Monitoring Tracking
How to Control CSA BASIC’s Analyze the Data, Train the Driver Require Driver Scorecard Accountability Consistently Manage Speed Require a Current Driver Duty Status Provide for a Completed Pre-Trip Every Light Burns, Every Mile, Every Day
Jeff Davis, C.D.S. Fleet Safety Services, LLC jeff@fleetsafetyservices.com 419-753-3319- office 419-733-7840- cell Jeff Davis, C.D.S.