Download
1 / 1
10 likes | 220 Views
LINKING MODIS IMAGERY WITH TURBIDITY AND TSS TIME SERIES DATA GENERATION OVER LAKE TANA, ETHIOPIA. Essayas K. Ayana* 1,3 , William D. Philpot 2 and Tammo S. Steenhuis 1,3 1 Department of Biological and Environmental Engineering, Cornell University, Ithaca, NY, USA

E N D
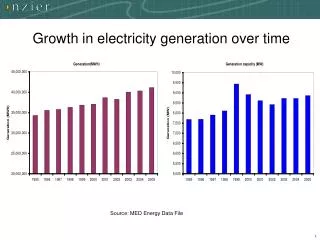
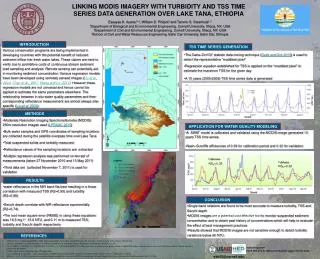
LINKING MODIS IMAGERY WITH TURBIDITY AND TSS TIME SERIES DATA GENERATION OVER LAKE TANA, ETHIOPIA Essayas K. Ayana*1,3, William D. Philpot2 and Tammo S. Steenhuis1,3 1Department of Biological and Environmental Engineering, Cornell University, Ithaca, NY, USA 2Department of Civil and Environmental Engineering, Cornell University, Ithaca, NY, USA 3School of Civil and Water Resources Engineering, Bahir Dar University, Bahir Dar, Ethiopia INTRODUCTION TSS TIME SERIES GENERATION Various conservation programs are being implemented in developing countries with the potential benefit of reduced sediment inflow into fresh water lakes. These claims are hard to verify due to prohibitive costs of continuous stream sediment load sampling and analysis. Remote sensing can potentially aid in monitoring sediment concentration. Various regression models have been developed using remotely sensed images (Hu et al., 2004, Chen et al., 2007, Wang and Lu, 2010). However these regression models are not universal and hence cannot be applied to estimate the same parameters elsewhere. The relationship between in situ water quality parameters and their corresponding reflectance measurement are almost always site-specific (Liu et al. 2003). • The Getis–OrdGi* statistic data mining technique (Getis and Ord 2010) is used to select the representative “muddiest pixel” • Regression equation established for TSS is applied on the “muddiest pixel” to estimate the maximum TSS for the given day • A 10 years (2000-2009) TSS time series data is generated METHODS • Moderate Resolution Imaging Spectroradiometer (MODIS) 250m resolution images used (LPDAAC 2010) • Bulk water samples and GPS coordinates of sampling locations are collected during the satellite overpass time over Lake Tana • Total suspended solids and turbidity measured • Reflectance values of the sampling locations are extracted • Multiple regression analysis was performed on two set of measurements (taken 27 November 2010 and 13 May 2011) • Third data set (collected November 7, 2011) is used for validation APPLICATION FOR WATER QUALITY MODELING • A SWAT model is calibrated and validated using the MODIS image generated 10 years TSS time series. • Nash–Sutcliffe efficiencies of 0.39 for calibration period and 0.32 for validation. NSE=0.39 NSE=0.32 RESULTS • water reflectance in the NIR band fits best resulting in a linear correlation with measured TSS (R2=0.95) and turbidity (R2=0.89) • Secchi depth correlate with NIR reflectance exponentially (R2=0.74) • The root mean square error (RMSE) in using these equations was 16.5 mg l-1 ,15.6 NTU, and 0.11 m to measured TSS, turbidity and Secchi depth respectively CONCLUSION • Single band relations are found to be most accurate to measure turbidity, TSS and Secchi depth • MODIS images are a potential cost effective toolto monitor suspended sediment concentration and to obtain past history of concentrations which will help to evaluate the effect of best management practices • Results showed that MODIS images are not sensitive enough to detect turbidity variations below 60 NTU. REFERENCES CHEN, Z., HU, C. & MULLER-KARGER, F. 2007. Monitoring turbidity in Tampa Bay using MODIS/Aqua 250-m imagery. Remote Sensing of Environment, 109, 207-220. GETIS, A., and ORD, J. K., 2010, The analysis of spatial association by use of distance statistics. Perspectives on Spatial Data Analysis, 127-145. HU, C., CHEN, Z., CLAYTON, T. D., SWARZENSKI, P., BROCK, J. C. & MULLER–KARGER, F. E. 2004. Assessment of estuarine water-quality indicators using MODIS medium-resolution bands: Initial results from Tampa Bay, FL. Remote Sensing of Environment, 93, 423-441. LPDAAC, 2010, Surface Reflectance Daily L2G Global 250m. LIU, Y., ISLAM, M. A., and GAO, J., 2003, Quantification of shallow water quality parameters by means of remote sensing. Progress in Physical Geography, 27, 24-43. WANG, J. J. & LU, X. 2010. Estimation of suspended sediment concentrations using Terra MODIS: An example from the Lower Yangtze River, China. Science of the Total Environment, 408, 1131-1138. Acknowledgement USDA-SRE and the HED provided partial support for this study. *ekk45@cornell.edu