Download
1 / 18
180 likes | 257 Views
Explore parallel and perpendicular lines, fitting data to lines, and predicting with linear models. Learn inequalities with addition and subtraction, solve examples, write, and graph inequalities. Practice using full and empty circles for visual representation.

E N D
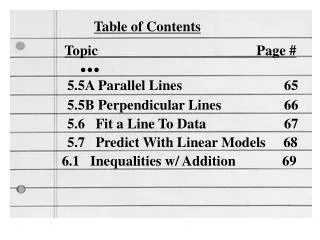
Table of Contents Topic Page # ... 5.5A Parallel Lines 65 5.5B Perpendicular Lines 66 5.6 Fit a Line To Data 67 5.7 Predict With Linear Models 68 6.1 Inequalities w/ Addition 69
Less Than • Empty Circle • Less Than or equal to • At most • No More Than • Full Circle
Greater Than • Empty Circle • Greater Than or equal to • At Least • No Less Than • Full Circle
Example 1: Write and graph an inequality. The highest temperature recorded in El Cajon was 113 degrees. -113 0 113
Example 1: Write and graph an inequality. You must be at least 13 years old to watch PG-13 movies. -13 0 13
Example 3: Solve AND graph an inequality using addition +9 +9 -12 0 12
Example 3: Solve AND graph an inequality using addition +5 +5 -8.5 0 8.5
Example 3: Solve AND graph an inequality using addition +9.2 +9.2 -4.2 0 4.2
Example 3: Solve AND graph an inequality using addition +1/2 +1/2 -½ 0 ½
Example 4: Solve AND graph an inequality using subtraction -7 -7 -2 0 2
Example 4: Solve AND graph an inequality using subtraction -5.5 -5.5 -0.5 0 0.5
Example 4: Solve AND graph an inequality using subtraction -14.9 -14.9 -17.6 0 17.6
Example 4: Solve AND graph an inequality using subtraction -23/6 0 23/6


