Download
1 / 29
290 likes | 465 Views
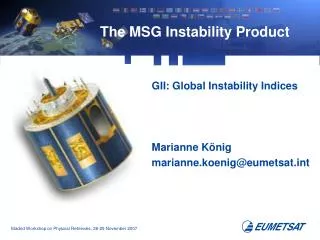
The MSG Instability Product. GII: Global Instability Indices Marianne König marianne.koenig@eumetsat.int. Instability?. Conditional and latent instability – parcel method Can lead to severe convection Satellite measurements: find out about this instability in pre-convective situations.

E N D
The MSG Instability Product GII: Global Instability Indices Marianne König marianne.koenig@eumetsat.int
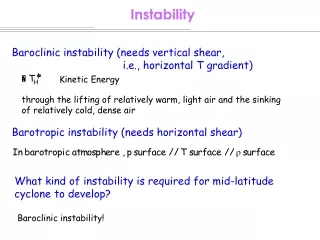
Instability? • Conditional and latent instability – parcel method • Can lead to severe convection • Satellite measurements: find out about this instability in pre-convective situations
The MPEF GII Product • 4 Instability Indices (empirical!): • Lifted Index • LI = Tobs - Tlifted from surface at 500 hPa (LI < 0 ) • K-Index: • KI = (Tobs(850) - Tobs(500)) + TDobs(850) - (Tobs(700) - TDobs(700) ) (KI > 25-30 C) • KO-Index: • KO = 0.5 * ( eobs(500) + eobs(700) - eobs(850) - eobs(1000) ) • Maximum Buoyancy: • MB = eobs(maximum between surface and 850) - eobs(minimum between 700 and 300) • And Total Precipitable Water
Some History • Channel selection on MSG also driven by a user demand for a GII-like product • 1998: External study proposed a statistical (neural network based) scheme with 15 input parameters • 2000-2001: Tests at EUMETSAT have shown major deficiency of statistical method, so algorithm was changed to a physical retrieval
What is a Physical Retrieval? • Optimal estimation or 1-DVar type of retrieval: • An atmospheric profile (T,q) is sought which best matches the MSG observed brightness temperatures • Background: Measurements TB depend on the atmospheric profile; for a given profile the measurements can be simulated by a radiative transfer model • J = TB - TB(sim.) • J is called the “cost function” and is minimised • TB(sim.) depend on the atm. profile • Equation can be expanded to accommodate measurement and model errors and to account for a first guess or background profile
Solution Strategy • Minimisation of the cost function means its derivate is zero – this leads to an iterative solution of the form • xn+1 = x0 + ( Sx-1 + Knt Se-1 Kn )-1 * (Knt Se-1 ( TB - TBn + Kn (xn - x0) )
Advantage of a Physical Retrieval • Results are based on a sound physical background • Method can be applied to any geographic region, to a different instrument, to a different set of channels, etc. • First guess profile (=forecast profile) adds additional information, which is needed in case of MSG • Cloud detection is “inherent” in the product: we do not find a minimum of the cost function in case of clouds
Application to MSG The instability parameters are derived from measured brightness temperatures in the six SEVIRI channels centred at 13.4 µm, 12.0 µm, 10.8 µm, 8.7 µm, 7.3 µm, and 6.2 µm wavelength The instability parameters can only be computed over cloud-free areas. An iterative retrieval scheme is used to compute the current atmospheric profiles of temperature and humidity. The scheme starts with a “first guess” (e.g. forecasted profile) and adjusts this profile to match the observed brightness temperatures. The underlying radiation model is RTTOV (also K-version)
Current Operational Product Lifted Index K-Index TPW
Example from South Africa 05 November 2005, 0645 UTC – operational K-Index
Convective Development 6 Hours later 05 November 2005, 1200 UTC – convection RGB
Operational Implementation • Product is derived every 15 minutes, as averages over 15 by 15 MSG pixels • Coarse resolution is seen as a problem, will be improved with MPEF hardware upgrades in 2008 • A regional product is available (via ftp) on a pixel resolution: ~250 by 250 pixel region
Local GII Installation in South Africa • With the South African Weather Service SAWS • Using their regional model data as background (Unified Model) • Running as 3 x 3 pixel averages, every 15 minutes • Validation study with lightning observations ongoing • 2006/2007 findings: ~0.80 POD, ~0.30 FAR for K-Index
Example of Operational GII Product 15 x 15 averages, total prec. water
Latest Improvements • Proper consideration of surface emissivity • (monthly pixel values, interpolated from MODIS measurements, provided by CIMMS) • Pixel values are now used within the radiation model with their correct surface emissivity
Effect on the Product Wrong IR8.7 emissivity Correct IR8.7 emissivity
Impact of Forecast Data • The physical retrieval seems to give “reasonable” results. • How does it compare to the underlying forecast? • Do we actually add information?
Old Example – GOES Sounder For the forecaster the satellite products are important in case of a wrong forecast of a really severeevent!
User Perspective • A number of case studies have been looked at • with SAWS (South Africa) • with ZAMG (Austria) • with IMGW (Poland) • Training material has been developed (EUMeTrain) • "Convection Workshop" in Krakow (15-17/11/07) sees this product as one ingrdient of a series of severe convection warning measures
Summary The physical retrieval, which uses the MSG measurements as additional information, does (mostly) not drastically change the forecast, but changes local extremes and gradients • Satellite Measurements provide extra information (gradients, intensity) • Instability Indices are only one measure to describe potential of convection • Other contributing factors, e.g. mesoscale wind field, orography