System-Level Memory Bus Power And Performance Optimization for Embedded Systems
System-Level Memory Bus Power And Performance Optimization for Embedded Systems. Ke Ning kning@ece.neu.edu David Kaeli kaeli@ece.neu.edu. Why Power is More Important?. “Power: A First Class Design Constraint for Future Architecture” – Trevor Mudge 2001

System-Level Memory Bus Power And Performance Optimization for Embedded Systems
E N D
Presentation Transcript
System-Level Memory Bus Power And Performance Optimization for Embedded Systems Ke Ning kning@ece.neu.edu David Kaeli kaeli@ece.neu.edu
Why Power is More Important? • “Power: A First Class Design Constraint for Future Architecture” – Trevor Mudge 2001 • Increasing complexity for higher performance (MIPS) • Parallelism, pipeline, memory/cache size • Higher clock frequency, larger die size • Rising dynamic power consumption • CMOS process continues to shrink: • Smaller size logic gates reduce Vthreshold • Lower Vthreshold will have higher leakage • Leakage power will exceed dynamic power • Things getting worse in Embedded System • Low power and low cost systems • Fixed or Limited applications/functionalities • Real-time systems with timing constraints
Power Breakdown of An Embedded System ResearchTarget 25°C1.2V Internal400MHz CCLK Blackfin Processor 3.3V External133MHz SDRAM27MHz PPI Source: Analog Devices Inc.
Introduction • Related work on microprocessor power • Low power design trend • Power metrics • Power performance tradeoffs • Power optimization techniques • Power estimation framework • Experimental framework built from Blackfin cycle accurate simulator • Validated through a Blackfin EZKit board • Power aware bus arbitration • Memory page remapping
Outline • Research Motivation and Introduction • Related Work • Power Estimation Framework • Optimization I – Power-Aware Bus Arbitration • Optimization II – Memory Page Remapping • Summary
Power Modeling • Dynamic power estimation • Instruction level model: [Tiwari94], JouleTrack[Sinha01] • Function level model: [Qu00] • Architecture model: Cai-Lim Model, TEMPEST[CaiLim99], Wattch[Brooks00], Simplepower[Ye00] • Static power estimation • Butts-Sohi model [Butts00] • Previous memory system power estimation • Activity model: CACTI[Wilton96] • Trace driven model: Dinero IV[Elder98]
Power Equation = + 2 P ACV f V N k I DD DD design leakage dynamic leakage Activity Factor Total Capacitance Voltage Frequency Transistor Number Technology factor
Common Power Optimization Techniques • Gating (turn off unused components) • Clock gating • Voltage gating: Cache decay [Hu01] • Scaling: (scale operating point of an component) • Voltage scaling: Drowsy cache [Flautner02] • Frequency scaling: [Pering98] • Resource scaling: DRAM power mode [Delaluz01] • Banking: (break single component into smaller sub-units) • Vertical sub-banking: Filter cache[Kin97] • Horizontal sub-banking: Scratchpad [Kandemir01] • Clustering: (partition components into clusters) • Switching reduction: (redesigning with lower activity) • Bus encoding: Permutation Code [Mehta96], redundant code[Stan95, Benini98], WZE[Musoll97]
Power Aware Figure of Merit • Delay, D • Performance, MIPS • Power, P • Battery life (mobile), packaging (high performance) • Obvious choice for power performance tradeoff, PD • Joules/instruction, inversely MIPS/W • Energy figure • Mobile / low power applications • Energy Delay PD2 • MIPS2/W [Gonzalez96] • Energy Delay Square PD3 • MIPS3/W • Voltage and frequency independent • More generically, MIPSm/W
Power Optimization Effect on Power Figure • Most of optimization schemes sacrifice performance for lower power consumption, except switching reduction. • All of optimization schemes generate higher power efficiency. • All of optimization schemes increase hardware complexity.
Outline • Research Motivation and Introduction • Related • Power Estimation Framework • Optimization I – Power-Aware Bus Arbitration • Optimization II – Memory Page Remapping • Summary
External Bus • External Bus Components • Typically is off-chip bus • Includes: Control Bus, Address Bus, Data Bus • External Bus Power Consumption • Dynamic power factors: activity, capacitance, frequency, voltage • Leakage power: supply voltage, threshold voltage, CMOS technology • Different from internal memory bus power: • Longer physical distance, higher bus capacitance, lower speed • Cross line interference, Higher leakage current • Different communication protocols (memory/peripheral dependent) • Multiplexed row/column address bus, narrower data bus
Embedded SOC System Architecture Media Processor Core SDRAM External Bus Interface Unit (EBIU) Data Cache Instruction Cache Internal Bus System DMA Controller External Bus FLASH Memory Memory DMA 0 Memory DMA 1 PPIDMA SPORT DMA Asynchronous Devices NTSC/PAL Encoder StreamingInterface PowerModelingArea S-Video/CVBS NIC
ADSP-BF533 EZ-Kit Lite Board Audio In Audio Out Video In & Out Video Codec/ ADV Converter Audio Codec/ AD Converter SPORT Data I/O BF533Blackfin Processor SDRAMMemory FLASH Memory
External Bus Power Estimator • Previous Approaches • Used Hamming distance [Benini98] • Control signal was not considered • Shared row and column address bus • Memory state transitions were not considered • In Our Estimator • Integrate memory control signal power into the model • Consider the case where row and column address are shared • Memory state transitions and stalls also cost power • Consider page miss penalty and traffic reverse penalty P(bus) = P(page miss) + P(bus turnaround) + P(control signal) + P(address generation) + P(data transmission) + P(leakage)
Two External Bus SDRAM Timing Models (a) SDRAM Access in Sequential Command Mode P N N A N N R R R R Bank 0 Request P N N A N N R R Bank 1 Request (b) SDRAM Access in Pipelined Command Mode P A N R R R R N Bank 0 Request P A R R R R Bank 1 Request System Clock Cycles (SCLK) N R P A - NOP - READ - PRECHARGE - ACTIVATE
Bus Power Simulation Framework Program Memory HierarchyModel Target BinaryCompiler Instruction LevelSimulator Memory TraceGenerator Memory PowerModel Memory TechnologyTiming Model External Bus Power Estimator Bus Power Developed software modules
Outline • Research Motivation and Introduction • Related Work • Power Estimation Framework • Optimization I – Power-Aware Bus Arbitration • Optimization II – Memory Page Remapping • Summary
Optimization I – Bus Arbitration • Multiple bus access masters in an SOC system • Processor cores • Data/Instruction caches • DMA • ASIC modules • Multimedia applications • High bus bandwidth throughput • Large memory footprint • Efficient arbitration algorithm can: • Increase power awareness • Increase bus throughput • Reduce bus power
Bus Arbitration Target Region Media Processor Core SDRAM EBIU with Arbitration Enabled Data Cache Instruction Cache Internal Bus System DMA Controller FLASH Memory External Bus Memory DMA 0 Memory DMA 1 PPIDMA SPORT DMA Asynchronous Devices NTSC/PAL Encoder StreamingInterface S-Video/CVBS NIC
Bus Arbitration Schemes • EBIU with arbitration enabled • Handle core-to-memory and core-to-peripheral communication • Resolve bus access contention • Schedule bus access requests • Traditional Algorithms • First Come First Serve (FCFS) • Fixed Priority • Power Aware Algorithms(Categorized by power metric / cost function) • Minimum Power (P1D0) or (1, 0) • Minimum Delay (P0D1) or (0, 1) • Minimum Power Delay Product (P1D1) or (1, 1) • Minimum Power Delay Square Product (P1D2) or (1, 2) • More generically (PnDm) or (n, m)
Bus Arbitration Schemes (Continued) • Power Aware Arbitration • From the current pending requests in the waiting queue, find a permutation of the external bus requests to achieve the minimum total power and/or performance cost. • Reducible to minimum Hamiltonian path problem in a graph G(V,E). • Vertex = Request R(t,s,b,l) • t – request arrival time • s – starting address • b – block size • l – read / write • Edge = Transition of Request i and j. • i,j - Request i and j • edge weight w(i, j) is cost of transition
Minimum Hamiltonian Path Problem R0 R0 – Last Request on the Bus. Must be the starting point of a path. R1, R2, R3 – Requests in the queue w(i,j) = P(i,j)nD(i,j)m P(i,j) – Power of Rj after Ri D(i,j) –Delay of Rj after Ri Hamiltonian Path: R0->R3->R1->R2 Minimum Path weight = w(0,3)+w(3,1)+w(1,2) NP-Complete Problem w(0,3) w(0,1) w(0,2) R3 R1 w(2,3) w(1,2) R2 w(3,2) w(2,1) w(1,3) w(3,1)
Greedy Solution R0 • Greedy Algorithm (local min) • Only the next request • in the path is needed • min{w(0,j) | • w(i,j) is the edge weight • of graph G(V,E)} w(0,3) w(0,1) w(0,2) R3 R1 w(2,3) w(1,2) R2 w(3,2) w(2,1) In each iteration of arbitration: 1. A new graph G(V,E) need to be constructed. 2. A greedy solution request is arbitrated to use the bus. w(1,3) w(3,1)
Experimental Setup • Utilized embedded power modeling framework • Implemented eleven different arbitration schemes inside EBIU • FCFS, FixedPriority. • minimum power (P1D0) or (1,0), minimum delay (P0D1) or (0, 1), and (1,1), (1,2), (2,1), (1,3), (3, 1), (3, 2), (2, 3) • 10 multimedia application benchmarks are ported to Blackfin architecture and simulated, including MPEG-2, H.264, JPEG, PGP and G.721.
Power Improvement • Power-aware arbitration schemes have lower power consumptions than Fixed Priority and FCFS. • Difference across different power-aware arbitration strategies is small. • Parallel Command model has 6-7% saving than Sequential Command model for MPEG2 ENC & DEC. • The results are consistent to all other benchmarks.
Speed Improvement • Power-aware schemes have smaller bus delay than traditional Fixed Priority and FCFS. • Difference across different power-aware arbitration strategies is small. • Parallel Command model has 3-9% speedup than Sequential Command model for MPEG2 ENC & DEC. • The results are consistent to all other benchmarks.
Comparison with Exhaustive Algorithm R0 • Greedy Algorithm can fail in certain case. • Complexity of O(n) vs O(n!). • Performance difference is negligible: Exhaustive Search Greedy Search 20 18 20 R3 R1 7 17 R2 15 5 18 17 new
Comments on Experimental Results • Power aware arbitrators significantly reduce the external bus power for all 8 benchmarks. In average, there are 14% power saving. • Power aware arbitrators reduce the bus access delay. The delay are reduced by 21% in average among 8 benchmarks. • Pipelined SDRAM model has big performance advantage over sequential SDRAM model. It achieve 6% power saving and 12% speedup. • Power and delay in external bus are highly correlated. Minimum power also achieves minimum delay. • Minimum power schemes will lead to simpler design options. Scheme (1,0) is preferred due to its simplicity.
Design of A Power Estimation Unit (PEU) Bank(0) Open Row Addr Bank(1) Open Row Addr Last Column Address Last Bank Address Bank(2) Open Row Addr Bank(3) Open Row Addr Next RequestAddress If not equal, output bank miss power Bank Addr Estimated Power Updated Column Addr If not equal, output page miss penalty power,update last column address register Row Addr Use hamming distanceto calculate column address data power Column Addr Power Estimation Unit (PEU)
Two Arbitrator Implementation Structures State Update Shared PEU Structure Memory/Bus States Info Request Queue Buffer t s b l t s b l External Bus AccessCommandGenerator Minimum Power Request Power Estimator Unit (PEU) Comparator t s b l t s b l Dedicated PEUStructure State Update Memory/Bus States Info Request Queue Buffer t s b l Power Estimator Unit t s b l Power Estimator Unit External Bus AccessCommandGenerator Minimum Power Request Power Estimator Unit Power Estimator Unit (PEU) Comparator t s b l t s b l
Performance of two structures • Higher PEU delay will lower the external bus performance for both MPEG-2 encoder and decoder. • When PEU delay is 5 or higher, dedicated structure is preferred than shared structure. Otherwise, shared structure is enough.
Summary of Bus Arbitration Schemes • Efficient bus arbitrations can provide benefits to both power and performance over traditional arbitration schemes. • Minimum power and minimum delay are highly correlated on external bus performance. • Pipelined SDRAM model has significant advantage over sequential SDRAM model. • Arbitration scheme (1, 0) is recommended. • Minimum power approach provides more design options and leads to simpler design implementations. The trade-off between design complexity and performance was presented.
Outline • Research Motivation and Introduction • Related Work • Power Estimation Framework • Optimization I – Power-Aware Bus Arbitration • Optimization II – Memory Page Remapping • Summary
Data Access Pattern in Multimedia Apps time time • 3 common data access patterns in multimedia applications • Majority of cycles in loop bodies and array accesses • High data access bandwidth • Poor locality, cross page references Fix Stride 2-Way Stream address address time 2-D Stride address
Previous work on Access Pattern • Previous work was performance driven and OS/compiler related approach • Data Pre-fetching [Chen94] [Zhang00] • Memory Customization [Adve00] [Grun01] • Data Layout Optimization [Catthoor98] [DeLaLuz04] • Shortcoming of OS/compiler-based strategies: • Multimedia benchmark’s dominant activities are within large monolithic data buffers. • Buffers generally contain many memory pages and can not be further optimized. • Constraint by the OS and compiler capability. Poor flexibility.
Optimization II - Page Remapping • Technique currently used in large memory space peripheral memory access. • External memories in embedded multimedia systems • High bus access overhead • Page miss penalty • Efficient page remapping can • Reduce page misses • Improve external bus throughput • Reduce power / energy consumption.
Page Remapping Target Region Media Processor Core SDRAM External Bus Interface Unit (EBIU) Data Cache Instruction Cache Internal Bus System DMA Controller FLASH Memory External Bus Memory DMA 0 Memory DMA 1 PPIDMA SPORT DMA Asynchronous Devices NTSC/PAL Encoder StreamingInterface S-Video/CVBS NIC
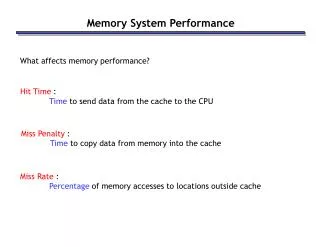
SDRAM Memory Pages • High memory access latency. Minimum latency of an sclk cycle • Page miss penalty • Additional latency due to refresh cycle • No guaranteed access due to arbitration logic • Non-sequential read/write would suffer Bank 0 Bank 1 Bank 2 Bank M-1 Page 0 X X Page 1 X* X X Page 2 X X X* X Page 3 X* Page 4 X X X* Page N-1
SDRAM Page Miss Penalty COMMAND P A R R R R P A R R R R DATA D D D D D D D D COMMAND P A R R R R R R R R DATA D D D D D D D D System Clock Cycles (SCLK) - DATA - NOP - READ D N - PRECHARGE - ACTIVATE R P A
SDRAM Timing Parameters • twp = write to precharge • trp = read to precharge • tras = activate to precharge • tcas = read latency • ~8-10 sclk penalty associated with a page miss
SDRAM Page Access Sequence (I) 12 Reads across 4 banks Bank 0 Bank 1 Bank 2 Bank 3 Page 0 R R R Page 1 R R R R R R Page 2 Page 3 R R R P AR P AR P AR P AR P AR P AR P AR P AR P AR P AR P AR P AR System Clock Typically access pattern of 2-D stride / 2-way stream. Poor data layout causes significant access overhead. P – Precharge A – Activation R - Read
SDRAM Page Access Sequence (II) 12 Reads across 4 banks Bank 0 Bank 1 Bank 2 Bank 3 Page 0 R R R R R R R R R R R R Page 1 Page 2 Page 3 P AR R R R R R R R R P AR P AR P AR System Clock Less access overhead with distributed data layout. P – Precharge A – Activation R - Read
Why we use Page Remapping Bank 0 Bank 1 Bank 2 Bank 3 Page 2 X X X X Page Remapping Entry of Page 2: {2,0,1,3} Page 2 X X X X
Module in an SOC System • Address translation unit, only translates bank address • Non-MMU system inserts a page remapping module before EBIU • MMU system can take advantage the existing address translation unit. No extra hardware needed SDRAM External Bus Interface Unit (EBIU) Page Remapping InternalBus FLASH Memory External Bus Asynchronous Devices
Sequence (I) after Remapping 12 Reads across 4 banks Bank 0 Bank 1 Bank 2 Bank 3 Page 0 R R R Page 1 R R R R R R Page 2 Page 3 R R R R R R R P AR R R R R P AR P AR P AR System Clock Same performance as sequence II. Applicable for monolithic data buffers (eg. frame buffers). P – Precharge A – Activation R - Read
Page Remapping Algorithm • NP complete problem. • Reducible to graph coloring problem in a page transition graph G(V,E). • Vertex = Page Im,n • m – page bank number • n – page row number • Edge = Transition of Page Im,n to Ip,q. • weighted edges captures page traversal during the program execution • edge weight is number of transition from Page Im,n to Page Ip,q • Color = Bank • Each bank have one distinct color. • Every page will be assigned one color.
Page Remapping Algorithm (continued) • Page Remapping Algorithm • From the page transition graph, find the color (bank) assignment for each page, such that the transition cost between same color pages is minimized. • Algorithm Steps: • Sort the edges based on their transition weight • Edges are process in a decreasing weight order • Color the pages associated with each edge • Weight parameter array for each page represents the cost of mapping that page into each bank eg: {500, 200, 0, 0} • 5 different situations of processing each edge • Page remapping table (PMT) is generated as a result of mapping.
Example Case 100 I0,0 I3,1 60 500 Bank 0 Bank 1 Bank 2 Bank 3 Page 0 I0,0 30 Page 1 I0,1 I1,1 I2,1 I3,1 I0,1 I2,1 50 Page 2 I1,2 Page 3 I1,3 40 80 Original page allocation I1,1 I1,3 200 I1,2 Page transition graph