Download
1 / 19
190 likes | 400 Views
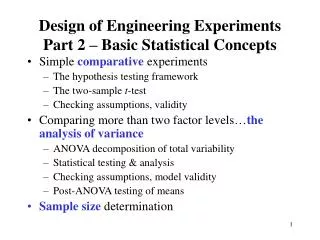
Design of Engineering Experiments Part 2 – Basic Statistical Concepts. Simple comparative experiments The hypothesis testing framework The two-sample t -test Checking assumptions, validity Comparing more than two factor levels… the analysis of variance

E N D
Design of Engineering ExperimentsPart 2 – Basic Statistical Concepts • Simple comparative experiments • The hypothesis testing framework • The two-sample t-test • Checking assumptions, validity • Comparing more than two factor levels…theanalysis of variance • ANOVA decomposition of total variability • Statistical testing & analysis • Checking assumptions, model validity • Post-ANOVA testing of means • Sample size determination
The Hypothesis Testing Framework • Statistical hypothesis testing is a useful framework for many experimental situations • Origins of the methodology date from the early 1900s • We will use a procedure known as the two-sample t-test
The Hypothesis Testing Framework • Sampling from a normal distribution • Statistical hypotheses:
Summary Statistics (pg. 36) Formulation 1 “New recipe” Formulation 2 “Original recipe”
How the Two-Sample t-Test Works: Use the sample means to draw inferences about the population means Difference in sample means is The inference is drawn by comparing the difference with standard deviation of the difference in sample means: Difference in sample means ──────────────────────────────── Standard deviation of the difference in sample means This suggests a statistic:
How the Two-Sample t-Test Works: • t0 is a “distance” measure-how far apart the averages are expressed in standard deviation units • Values of t0 that are near zero are consistent with the null hypothesis • Values of t0 that are very different from zero are consistent with the alternative hypothesis • Notice the interpretation of t0 as a signal-to-noiseratio
The Two-Sample (Pooled) t-Test The two sample means are about 2 standard deviations apart. Is this a “large” difference?
The Two-Sample (Pooled) t-Test • So far, we haven’t really done any “statistics” • We need an objective basis for deciding how large the test statistic t0 really is • In 1908, W. S. Gosset derived the referencedistribution for t0 … called the t distribution • Tables of the t distribution - text, page 606
The Two-Sample (Pooled) t-Test • A value of t0 between –2.101 and 2.101 is consistent with equality of means • It is possible for the means to be equal and t0 to exceed either 2.101 or –2.101, but it would be a “rareevent” … leads to the conclusion that the means are different • Could also use the P-value approach
The Two-Sample (Pooled) t-Test • The P-value is the risk of wrongly rejecting the null hypothesis of equal means (it measures rareness of the event) • The P-value in our problem is P = 0.0411 • The null hypothesis Ho: m1 = m2 would be rejected at any level of significance a≥ 0.0411.
Minitab Two-Sample t-Test Results Two-Sample T-Test and CI: Form 1, Form 2 Two-sample T for Form 1 vs Form 2 N Mean StDev SE Mean Form 1 10 16.764 0.316 0.10 Form 2 10 17.042 0.248 0.078 Difference = mu Form 1 - mu Form 2 Estimate for difference: -0.278000 95% CI for difference: (-0.545073, -0.010927) T-Test of difference = 0 (vs not =): T-Value = -2.19 P-Value = 0.042 DF = 18 Both use Pooled StDev = 0.2843
Importance of the t-Test • Provides an objective framework for simple comparative experiments • Could be used to test all relevant hypotheses in a two-level factorial design, because all of these hypotheses involve the mean response at one “side” of the cube versus the mean response at the opposite “side” of the cube
Confidence Intervals (See pg. 43) • Hypothesis testing gives an objective statement concerning the difference in means, but it doesn’t specify “how different” they are • Generalform of a confidence interval • The 100(1- )% confidenceinterval on the difference in two means: