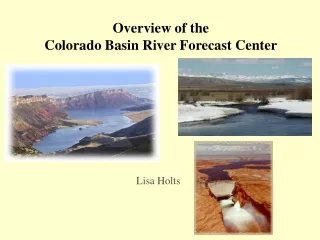
Lower Colorado Basin
120 likes | 274 Views
Lower Colorado Basin. CRFS March 30, 2010. Virgin River. March 1. March 25. NWS-SWS: 90 NWS-ESP: 60 55 (+8-15% El Nino weighted) NRCS daily: 80 NRCS statistical: 78 Coordinated: 80 / 195% median or 125% average. A comparison with 2005.

Lower Colorado Basin
E N D
Presentation Transcript
Lower Colorado Basin CRFS March 30, 2010
March 1 March 25 NWS-SWS: 90 NWS-ESP: 60 55 (+8-15% El Nino weighted) NRCS daily: 80 NRCS statistical: 78 Coordinated: 80 / 195% median or 125% average
A comparison with 2005 Virgin Basin Snow Plot 2005 / 2010 / Average Virgin River Flow (incl. Santa Clara) 2005 2005 Flood 2005 snowmelt
National Operational Hydrologic Remote Sensing Center - NOAA Virgin Basin 6100 ft Salt Basin 6800 ft
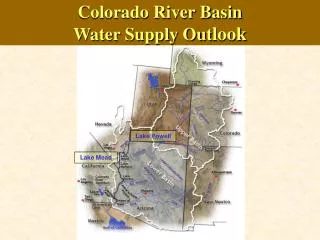
2010 LOWER COLORADO BASINLAKE MEAD LOCAL (Intervening Flow) ESP Generated March120 KAF (100% of average) April 120 KAF (104% of average) May 80 KAF ( 96% of average) April - July Forecast: 270 KAF ( 93% of average) March - July Forecast: 390 KAF ( 95% of average)
Paria River Muddy Creek Virgin River Little Colorado Colorado River - Lake Powell to Diamond Fork Intervening Flow Forecasts: Lake Powell to Lake Mead / Where is the skill ?
Lake Mead Inflow Inflow Between Powell & Mead: Annual Inflow Powell to Mead Tributary Distribution (CBRFC calculated using USGS gages)
Forecast Periods: Virgin Basin (Snow + Rain) & Arizona Basins (Rain, some snow) Virgin River Basin April – July Runoff Arizona & New Mexico Basins Progressive Forecast Period Jan-May Jan 15 – May Feb – May Etc.
Winter 2010 Highlights Winter storm pattern that resulted was in line with the El Nino climate conditions Significant rainfall in the Lower Colorado during the 3rd week of January (~10” in 24 hrs) Very large snowpack in Arizona, significant snow at lower elevations Much above median volumes observed in January, much above median seasonal volumes expected. Forecast Challenge: Possibility of additional large precipitation events (El Nino) Forecast Challenge: The non-typical large snowpack and resulting volumes. Forecast Challenge: Dry soils exist under high elevation snowpack. 2010 LOWER COLORADO BASINSALT / VERDE
January flows in the Lower Colorado Basin January 20-23, 2010 Precipitation Jan Volume 850 % of median Feb Volume 710 % of median
Salt River - Roosevelt Weighting ESP for El Nino years resulted in: Feb 1st Forecast (Feb-May) of +27% over raw ESP Mar 1 Forecast (Mar-May) of + 5% over raw ESP