Download
1 / 16
160 likes | 326 Views
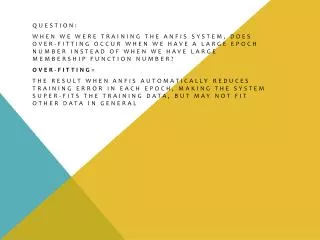
Question: When we were training the anfis system, does over-fitting occur when we have a large epoch number instead of when we have large membership function number? Over-fitting =

E N D
Question: When we were training the anfis system, does over-fitting occur when we have a large epoch number instead of when we have large membership function number? Over-fitting= the result when anfis automatically reduces training error in each epoch, making the system super-fits the training data, but may not fit other data in general
Our best fis system is the one called “ampFisUnfiltered3.fis” which uses the following criteria: • Unfiltered data • Number of membership function=3 • Type of membership function=‘gbellmf’ • epoch_n=20
Using the following code, we can estimate temperatures if we know avgAmp(average amplitude, our measured feature) • fis=readfis('ampFisUnfiltered3.fis‘) • temp_eval=evalfis(avgAmp,fis)
20100110-20100118 data plot, average amp against temperature
20100103-20100115 data plot, average amp against temperature
E.g avgAmp=0.0200018485069275 temp_eval=evalfis(avgAmp,fis) >>> temp_eval=81.4416
However, the true temperature is 70.7378, • We have an error of 81.4416-70.7378=10.7038 Which is considerably big, about 15% of true value. Could it be that our fis, “ampFisUnfiltered3.fis” is not a good model to predict this relationship between avgAmp and temperature? presentableData.xlsx
right Skew - the mass of the distribution is concentrated on the left of the figure. It has relatively few high values Also referred to as positive skew
Another thing to be noticed, exactly 105 out of the 130 big-error data points are measured under stressed condition (elevated temperature) • this might suggest: Average amplitude of chicken vocalization as a feature of stress level works well under low-stress environment, but produces wider ranges of fluctuation under high stressed ones.
Changing the type of membership function • This time we change Type of membership function=‘gaussmf’ While holding other variables constant Let’s see the behavior of this new fis system: ‘ampFisUnfiltered3Gaussmf.fis’ mfComparedataUnStressed.xlsx mfComparedataStressed.xlsx
The average error and standard deviation of error vary within the two fis systems • However, after calculating the Mean Square Error for both sytems, both stressed and unstressed
The smaller the MSE, the better the fis system • You can see that although very similar, it’s hard to tell which one is a better parameter, “gbellmf” or “gaussmf” since their corresponding MSE value varies for stressed and unstressed • Also the errors in unstressed groups are a lot smaller than those generated by stressed groups, which again proves our point saying “Average amplitude of chicken vocalization as a feature of stress level works well under low-stress environment, but produces wider ranges of fluctuation under high stressed ones.”