Download
1 / 1
10 likes | 144 Views
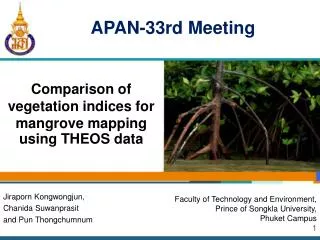
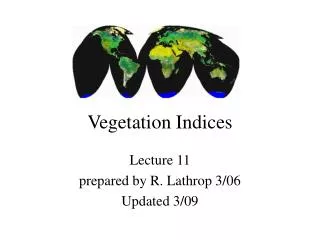
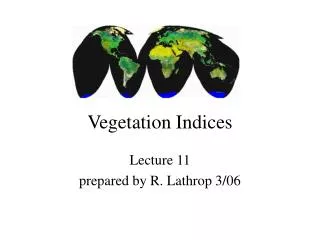
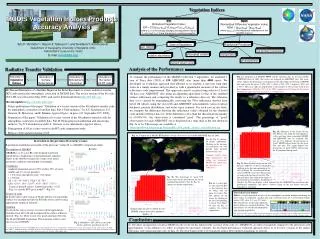
Figure 1. Figure 2. Figure 4. Figure 3. Figure 5. Figure 6. Development of Vegetation Indices as Economic Thresholds for Control of Defoliating Insects of Soybean. Introduction Current criterion for insecticide application : economic threshold

E N D
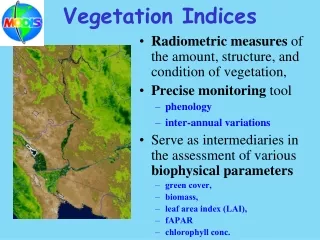
Figure 1 Figure 2 Figure 4 Figure 3 Figure 5 Figure 6 Development of Vegetation Indices as Economic Thresholds for Control of Defoliating Insects of Soybean • Introduction • Current criterion for insecticide application : economic threshold • Labor Intensive : motivated research into alternate methods • Because insect defoliation reduces yield through light interception effects on canopy photosynthetic activity and/or crop growth rate, light interception and LAI have been explored as possible economic thresholds for insecticide application. • Results indicated that during the first half of the seed filling period, yield was reduced only when defoliation was severe enough to reduce LAI below about 3.5, a level at which light interception started falling below the optimal 95% level. • Remote sensing techniques that determine canopy reflectance ratios (vegetation indices) may be useful in determining critical levels of LAI and/or light interception at which insecticide application is justified. • Materials and Methods • 2004 Study • Differences in LAI and light interception were mainly created by manual defoliation. Experimental design was a randomized complete block with four replications in a split-plot arrangement. Main plots were two commercial soybean cultivars ‘Asgrow 5902’ (Maturity Group V, determinate growth) and ‘Hartz4998’ (Maturity Group IV, indeterminate growth). Split plots were five defoliation treatments administered during the first week of September, 2004, two weeks after the start of seed filling (R5). • Treatments were manual defoliation (random leaf removal) to create the following LAI levels: 1. 0% defoliation (control); 2. 33% defoliation; 3. 50% defoliation; 4. 66% defoliation; and 5. 100% defoliation. Treatments were administered to six contiguous rows within each plot. • After completion of defoliation treatments all plots were sampled (0.5 m2) for LAI and light interception on 8 Sep. • Digital images of the plots were recorded on 15 Sep 2004 using a camera system mounted on a pole truck. • The collected images were converted into NDVI, GNDVI, and SR using Leica Geosystems ERDAS software to process the digital imagery. Average Red (R), Green (G), and near infra-red (NIR) values were determined as follows: red values were centered at a 670 nm wavelength with a 40 nm bandpass; near infra-red was centered at 800 nm with a 60 nm bandpass; and green was centered at a 500 nm wavelength having a 40 nm bandpass. • 2005 Study • More cultivars were included in the 2005 study for purposes of detecting possible interactions of Maturity Group (III, IV, and V) and growth habit (determinate and indeterminate) on relationships between LAI/light interception with vegetation indices. • Differences in LAI and light interception were created by planting date and cultivar in the second year of the study. Plant size generally declines as planting date is delayed from the normal period and cultivar maturity group declines. Our purpose was to use these two factors to create a wide range of canopy sizes to determine the predictive use of NDVI, GNDVI, and SR. • Experimental design was a randomized complete block in a split plot arrangement with four replications. Main plots were three planting dates: an optimal planting on 5 May 2005, a moderately late planting on 14 June 2005, and a late planting on 25 July 2006. Splits plots were four cultivars: AG3905 (Maturity Group III), DP4331 (Maturity Group IV), P95M80 (MaturityGroup V), and AG5903 (Maturity Group V). • Sampling for LAI and light interception occurred near to the mid to late seed filling period for cultivars planted in May, the early seed filling period for those planted in June, and the early flowering period for the July planting date. Digital photography was accomplished on 26 Aug 2005 near 1200 h using the same method as in 2004. • Objectives • General Objectives • Determine the feasibility of using vegetation indices derived from digital photography to identify areas in a soybean field requiring insecticide application for defoliating insects. • Specific Objectives • Determine the relative accuracy of three vegetation indices CNDVI, SR, and GNDVI for predicting LAI and light interception across canopies ranging from very low LAI to canopy cover. • If accuracy is verified, to develop a system for using vegetation indices as economic thresholds based on the normal progression of LAI and light interception during the seed filling period. • Data Analysis • Within both years, correlation and regression analyses between vegetation indices (NDVI, GNDVI, and SR) and canopy parameters (LAI and light interception) were conducted. Analyses were done for treatment combinations averaged across replications: defoliation x cultivar treatment combinations in 2004 and planting date x cultivar treatment combinations in 2005. Regression analyses were done using SAS PROC GLM in which linear, quadratic, and cubic components were successively tested for significance and included if the residual sum of squares was significantly reduced (p<0.05). • Homogeneity of regression equations across years for specific vegetation index/canopy parameter relationships was accomplished with SAS PROC GLM. Homogenous regression equations were pooled across years. • Results • Regression relationships between LAI and light interception with NDVI, GNDVI, and SR varied from linear to quadratic to cubic (Figs. 1-6). • Regression relationships between specific vegetation indices with either LAI or light interception were not homogenous across years, and therefore are presented separately by year. • Simple linear relationships were shown for LAI and light interception regressed on NDVI in both years (Figs. 1 and 2) (r2=0.93-0.97). • Green NDVI showed linear relationships with LAI and light interception in 2004, but not 2005 (relationships were quadratic) (Figs. 3 and 4). • The SR showed the most complicated relationships with LAI and light interception, having quadratic and cubic relationships in 2004 and 2005, respectively (Figs. 5 and 6). • Discussion • For purposes of identifying canopies where light interception falls below 95% (indicating the need for insecticide), the NDVI was the most appropriate vegetation index to use. The strong linear regressions of NDVI with LAI and light interception levels ranging from near-total defoliation to canopy closure (95% light interception; LAI>4.3, Figs. 1 and 2) demonstrate that this reflectance ratio accurately predicts LAI and light interception as these parameters fall from optimal to suboptimal levels. The GNDVI and SR did not maintain linear relationships up to canopy closure as shown by NDVI (Figs. 3-6). For both vegetation indices in 2004 and 2005, relationships with LAI and light interception were linear up to an LAI of 3.0 and 70% light interception. However, above this level, both canopy parameters showed plateau responses to further increases in either GNDVI or SR. Consequently, neither vegetation index could distinguish between optimal LAI/light interception levels (3.5-4.0, 95%), and the suboptimal levels below this when insecticide application is warranted to prevent yield loss. • Conclusion • Because of its strong linear relationship with LAI and light interception across a broad range of canopy cover, NDVI demonstrated potential use as an economic threshold for identifying canopy parameters (95% light interception; LAI 3.5-4.0) recognized as indicators for insecticide application during seed filling.